1. Sarafidis, P.A.; Nilsson, P.M. The metabolic syndrome: A glance at its history. J. Hypertens. 2006, 24, 621�626.
[CrossRef] [PubMed]
2. Alberti, K.G.; Zimmet, P.Z. Definition, diagnosis and classification of diabetes mellitus and its complications.
Part 1: Diagnosis and classification of diabetes mellitus provisional report of a WHO consultation.
Diabet. Med. 1998, 15, 539�553. [CrossRef]
3. Balkau, B.; Charles, M.A. Comment on the provisional report from the WHO consultation. European Group
for the Study of Insulin Resistance (EGIR). Diabet. Med. 1999, 16, 442�423. [PubMed]
4. Expert Panel on Detection, Evaluation, and Treatment of High Blood Cholesterol in Adults. Executive
Summary of The Third Report of The National Cholesterol Education Program (NCEP) Expert Panel on
Detection, Evaluation, and Treatment of High Blood Cholesterol in Adults (Adult Treatment Panel III). JAMA
2001, 285, 2486�2497.
5. Grundy, S.M.; Cleeman, J.I.; Daniels, S.R.; Donato, K.A.; Eckel, R.H.; Franklin, B.A.; Gordon, D.J.;
Krauss, R.M.; Savage, P.J.; Smith, S.C., Jr.; et al. Diagnosis and management of the metabolic syndrome:
An American Heart Association/National Heart, Lung, and Blood Institute Scientific Statement. Circulation
2005, 112, 2735�2752. [CrossRef] [PubMed]
6. Alberti, K.G.; Zimmet, P.; Shaw, J. The metabolic syndrome�A new worldwide definition. Lancet 2005, 366,
1059�1062. [CrossRef]
7. Selassie, M.; Sinha, A.C. The epidemiology and aetiology of obesity: A global challenge. Best Pract. Res.
Clin. Anaesthesiol. 2011, 25, 1�9. [CrossRef] [PubMed]
8. WHO, W.H.O. Available online: http://www.who.int/mediacentre/factsheets/fs311/es/ (accessed on
4 June 2016).
9. Shimano, H. Novel qualitative aspects of tissue fatty acids related to metabolic regulation: Lessons from
Elovl6 knockout. Prog. Lipid Res. 2012, 51, 267�271. [CrossRef] [PubMed]
10. Bosomworth, N.J. Approach to identifying and managing atherogenic dyslipidemia: A metabolic
consequence of obesity and diabetes. Can. Fam. Phys. 2013, 59, 1169�1180.
11. Vidal-Puig, A. The Metabolic Syndrome and its Complex Pathophysiology. In A Systems Biology Approach to
Study Metabolic Syndrome; Oresic, M., Ed.; Springer: New York, NY, USA, 2014; pp. 3�16.
12. Poitout, V.; Robertson, R.P. Glucolipotoxicity: Fuel excess and beta-cell dysfunction. Endocr. Rev. 2008, 29,
351�366. [CrossRef] [PubMed]
13. Rizza, W.; Veronese, N.; Fontana, L. What are the roles of calorie restriction and diet quality in promoting
healthy longevity? Ageing Res. Rev. 2014, 13, 38�45. [CrossRef] [PubMed]
14. Lloyd-Jones, D.M.; Levy, D. Epidemiology of Hypertension. In Hypertension: A Companion to Braunwald�s
Heart Disease; Black, H.R., Elliott, W.J., Eds.; Elsevier: Philadephia, PA, USA, 2013; pp. 1�11.
15. Zanchetti, A. Challenges in hypertension: Prevalence, definition, mechanisms and management. J. Hypertens.
2014, 32, 451�453. [CrossRef] [PubMed]
16. Thomas, G.; Shishehbor, M.; Brill, D.; Nally, J.V., Jr. New hypertension guidelines: One size fits most?
Clevel. Clin. J. Med. 2014, 81, 178�188. [CrossRef] [PubMed]
17. James, P.A.; Oparil, S.; Carter, B.L.; Cushman, W.C.; Dennison-Himmelfarb, C.; Handler, J.; Lackland, D.T.;
LeFevre, M.L.; MacKenzie, T.D.; Ogedegbe, O.; et al. 2014 evidence-based guideline for the management
of high blood pressure in adults: Report from the panel members appointed to the Eighth Joint National
Committee (JNC 8). JAMA 2014, 311, 507�520. [CrossRef] [PubMed]
18. Klandorf, H.; Chirra, A.R.; DeGruccio, A.; Girman, D.J. Dimethyl sulfoxide modulation of diabetes onset in
NOD mice. Diabetes 1989, 38, 194�197. [CrossRef] [PubMed]
19. Ballard, K.D.; Mah, E.; Guo, Y.; Pei, R.; Volek, J.S.; Bruno, R.S. Low-fat milk ingestion prevents postprandial
hyperglycemia-mediated impairments in vascular endothelial function in obese individuals with metabolic
syndrome. J. Nutr. 2013, 143, 1602�1610. [CrossRef] [PubMed]
20. Pugliese, G.; Solini, A.; Bonora, E.; Orsi, E.; Zerbini, G.; Fondelli, C.; Gruden, G.; Cavalot, F.; Lamacchia, O.;
Trevisan, R.; et al. Distribution of cardiovascular disease and retinopathy in patients with type 2 diabetes
according to different classification systems for chronic kidney disease: A cross-sectional analysis of the
renal insufficiency and cardiovascular events (RIACE) Italian multicenter study. Cardiovasc. Diabetol. 2014,
13, 59. [PubMed]
21. Asif, M. The prevention and control the type-2 diabetes by changing lifestyle and dietary pattern. J. Educ.
Health Promot. 2014, 3, 1. [CrossRef] [PubMed]
22. Russell, W.R.; Baka, A.; Bjorck, I.; Delzenne, N.; Gao, D.; Griffiths, H.R.; Hadjilucas, E.; Juvonen, K.;
Lahtinen, S.; Lansink, M.; et al. Impact of Diet Composition on Blood Glucose Regulation. Crit. Rev. Food
Sci. Nutr. 2016, 56, 541�590. [CrossRef] [PubMed]
23. Soares, R.; Costa, C. Oxidative Stress, Inflammation and Angiogenesis in the Metabolic Syndrome; Springer:
Heidelberg, Germany, 2009.
24. Rahal, A.; Kumar, A.; Singh, V.; Yadav, B.; Tiwari, R.; Chakraborty, S.; Dhama, K. Oxidative Stress,
Prooxidants, and Antioxidants: The Interplay. BioMed Res. Int. 2014, 2014, 761264. [CrossRef] [PubMed]
25. Parthasarathy, S.; Litvinov, D.; Selvarajan, K.; Garelnabi, M. Lipid peroxidation and decomposition�Conflicting
roles in plaque vulnerability and stability. Biochim. Biophys. Acta 2008, 1781, 221�231. [CrossRef] [PubMed]
26. McGrowder, D.; Riley, C.; Morrison, E.Y.; Gordon, L. The role of high-density lipoproteins in reducing the
risk of vascular diseases, neurogenerative disorders, and cancer. Cholesterol 2011, 2011, 496925. [CrossRef]
[PubMed]
27. Ferri, N.; Ruscica, M. Proprotein convertase subtilisin/kexin type 9 (PCSK9) and metabolic syndrome:
Insights on insulin resistance, inflammation, and atherogenic dyslipidemia. Endocrine 2016. [CrossRef]
28. Oresic, M.; Vidal-Puig, A. A Systems Biology Approach to Study Metabolic Syndrome; Springer: Heidelberg,
Germany, 2014.
29. Lee, E.G.; Choi, J.H.; Kim, K.E.; Kim, J.H. Effects of a Walking Program on Self-management and Risk Factors
of Metabolic Syndrome in Older Korean Adults. J. Phys. Ther. Sci. 2014, 26, 105�109. [CrossRef] [PubMed]
30. Bernabe, G.J.; Zafrilla, R.P.; Mulero, C.J.; Gomez, J.P.; Leal, H.M.; Abellan, A.J. Biochemical and nutritional
markers and antioxidant activity in metabolic syndrome. Endocrinol. Nutr. 2013, 61, 302�308.
31. Bales, C.W.; Kraus, W.E. Caloric restriction: Implications for human cardiometabolic health. J. Cardiopulm.
Rehabil. Prev. 2013, 33, 201�208. [CrossRef] [PubMed]
32. Grams, J.; Garvey, W.T. Weight Loss and the Prevention and Treatment of Type 2 Diabetes Using Lifestyle
Therapy, Pharmacotherapy, and Bariatric Surgery: Mechanisms of Action. Curr. Obes. Rep. 2015, 4, 287�302.
[CrossRef] [PubMed]
33. Lazo, M.; Solga, S.F.; Horska, A.; Bonekamp, S.; Diehl, A.M.; Brancati, F.L.; Wagenknecht, L.E.; Pi-Sunyer, F.X.;
Kahn, S.E.; Clark, J.M. Effect of a 12-month intensive lifestyle intervention on hepatic steatosis in adults with
type 2 diabetes. Diabetes Care 2010, 33, 2156�2163. [CrossRef] [PubMed]
34. Rossmeislova, L.; Malisova, L.; Kracmerova, J.; Stich, V. Adaptation of human adipose tissue to hypocaloric
diet. Int. J. Obes. 2013, 37, 640�650. [CrossRef] [PubMed]
35. Wing, R.R.; Lang, W.; Wadden, T.A.; Safford, M.; Knowler, W.C.; Bertoni, A.G.; Hill, J.O.; Brancati, F.L.;
Peters, A.; Wagenknecht, L. Benefits of modest weight loss in improving cardiovascular risk factors in
overweight and obese individuals with type 2 diabetes. Diabetes Care 2011, 34, 1481�1486. [CrossRef]
[PubMed]
36. Golay, A.; Brock, E.; Gabriel, R.; Konrad, T.; Lalic, N.; Laville, M.; Mingrone, G.; Petrie, J.; Phan, T.M.;
Pietilainen, K.H.; et al. Taking small steps towards targets�Perspectives for clinical practice in diabetes,
cardiometabolic disorders and beyond. Int. J. Clin. Pract. 2013, 67, 322�332. [CrossRef] [PubMed]
37. Fock, K.M.; Khoo, J. Diet and exercise in management of obesity and overweight. J. Gastroenterol. Hepatol.
2013, 28, 59�63. [CrossRef] [PubMed]
38. Abete, I.; Parra, D.; Martinez, J.A. Energy-restricted diets based on a distinct food selection affecting the
glycemic index induce different weight loss and oxidative response. Clin. Nutr. 2008, 27, 545�551. [CrossRef]
[PubMed]
39. Alberti, K.G.; Eckel, R.H.; Grundy, S.M.; Zimmet, P.Z.; Cleeman, J.I.; Donato, K.A.; Fruchart, J.C.; James, W.P.;
Loria, C.M.; Smith, S.C., Jr. Harmonizing the metabolic syndrome: A joint interim statement of the
International Diabetes Federation Task Force on Epidemiology and Prevention; National Heart, Lung,
and Blood Institute; American Heart Association; World Heart Federation; International Atherosclerosis
Society; and International Association for the Study of Obesity. Circulation 2009, 120, 1640�1645. [PubMed]
40. Fleming, J.A.; Kris-Etherton, P.M. The evidence for alpha-linolenic acid and cardiovascular disease benefits:
Comparisons with eicosapentaenoic acid and docosahexaenoic acid. Adv. Nutr. 2014, 5, 863S�876S. [CrossRef]
[PubMed]
41. Gray, B.; Steyn, F.; Davies, P.S.; Vitetta, L. Omega-3 fatty acids: A review of the effects on adiponectin and
leptin and potential implications for obesity management. Eur. J. Clin. Nutr. 2013, 67, 1234�1242. [CrossRef]
[PubMed]
42. Wen, Y.T.; Dai, J.H.; Gao, Q. Effects of Omega-3 fatty acid on major cardiovascular events and mortality
in patients with coronary heart disease: A meta-analysis of randomized controlled trials. Nutr. Metab.
Cardiovasc. Dis. 2014, 24, 470�475. [CrossRef] [PubMed]
43. Lopez-Huertas, E. The effect of EPA and DHA on metabolic syndrome patients: A systematic review of
randomised controlled trials. Br. J. Nutr. 2012, 107, 185�194. [CrossRef] [PubMed]
44. Maiorino, M.I.; Chiodini, P.; Bellastella, G.; Giugliano, D.; Esposito, K. Sexual dysfunction in women with
cancer: A systematic review with meta-analysis of studies using the Female Sexual Function Index. Endocrine
2016, 54, 329�341. [CrossRef] [PubMed]
45. EFSA NDA Panel (EFSA Panel on Dietetic Products, Nutrition and Allergies). Scientific Opinion on Dietary
Reference Values for fats, including saturated fatty acids, polyunsaturated fatty acids, monounsaturated
fatty acids, trans fatty acids, and cholesterol1. EFSA J. 2010, 8, 1461�1566.
46. Bellastella, G.; Bizzarro, A.; Aitella, E.; Barrasso, M.; Cozzolino, D.; di Martino, S.; Esposito, K.; de Bellis, A.
Pregnancy may favour the development of severe autoimmune central diabetes insipidus in women with
vasopressin cell antibodies: Description of two cases. Eur. J. Endocrinol. 2015, 172, K11�K17. [CrossRef]
[PubMed]
47. Sun, F.H.; Li, C.; Zhang, Y.J.; Wong, S.H.; Wang, L. Effect of Glycemic Index of Breakfast on Energy Intake at
Subsequent Meal among Healthy People: A Meta-Analysis. Nutrients 2016, 8, 37. [CrossRef] [PubMed]
48. Barclay, A.W.; Brand-Miller, J.C.; Wolever, T.M. Glycemic index, glycemic load, and glycemic response are
not the same. Diabetes Care 2005, 28, 1839�1840. [CrossRef] [PubMed]
49. Nakagawa, T.; Hu, H.; Zharikov, S.; Tuttle, K.R.; Short, R.A.; Glushakova, O.; Ouyang, X.; Feig, D.I.;
Block, E.R.; Herrera-Acosta, J.; et al. A causal role for uric acid in fructose-induced metabolic syndrome.
Am. J. Physiol. Ren. Physiol. 2006, 290, F625�F631. [CrossRef] [PubMed]
50. Symons Downs, D.; Hausenblas, H.A. Women�s exercise beliefs and behaviors during their pregnancy and
postpartum. J. Midwifery Women Health 2004, 49, 138�144.
51. Brand-Miller, J.; McMillan-Price, J.; Steinbeck, K.; Caterson, I. Dietary glycemic index: Health implications.
J. Am. Coll. Nutr. 2009, 28, 446S�449S. [CrossRef] [PubMed]
52. Thomas, D.; Elliott, E.J. Low glycaemic index, or low glycaemic load, diets for diabetes mellitus.
Cochrane Database Syst. Rev. 2009. [CrossRef]
53. Barrea, L.; Balato, N.; di Somma, C.; Macchia, P.E.; Napolitano, M.; Savanelli, M.C.; Esposito, K.; Colao, A.;
Savastano, S. Nutrition and psoriasis: Is there any association between the severity of the disease and
adherence to the Mediterranean diet? J. Transl. Med. 2015, 13, 18. [CrossRef] [PubMed]
54. Mathias, K.C.; Ng, S.W.; Popkin, B. Monitoring changes in the nutritional content of ready-to-eat grain-based
dessert products manufactured and purchased between 2005 and 2012. J. Acad. Nutr. Diet. 2015, 115, 360�368.
[CrossRef] [PubMed]
55. Serafini, M.; del Rio, D. Understanding the association between dietary antioxidants, redox status and
disease: Is the Total Antioxidant Capacity the right tool? Redox Rep. 2004, 9, 145�152. [CrossRef] [PubMed]
56. Bellastella, G.; Maiorino, M.I.; Olita, L.; della Volpe, E.; Giugliano, D.; Esposito, K. Premature ejaculation is
associated with glycemic control in Type 1 diabetes. J. Sex. Med. 2015, 12, 93�99. [CrossRef] [PubMed]
57. Zulet, M.A.; Moreno-Aliaga, M.J.; Martinez, J.A. Dietary Determinants of Fat Mass and Body Composition.
In Adipose Tissue Biology; Symonds, M.E., Ed.; Springer: New York, NY, USA, 2012; pp. 271�315.
58. Carlsen, M.H.; Halvorsen, B.L.; Holte, K.; Bohn, S.K.; Dragland, S.; Sampson, L.; Willey, C.; Senoo, H.;
Umezono, Y.; Sanada, C.; et al. The total antioxidant content of more than 3100 foods, beverages, spices,
herbs and supplements used worldwide. Nutr. J. 2010, 9, 3. [CrossRef] [PubMed]
59. Harasym, J.; Oledzki, R. Effect of fruit and vegetable antioxidants on total antioxidant capacity of blood
plasma. Nutrition 2014, 30, 511�517. [CrossRef] [PubMed]
60. Maiorino, M.I.; Bellastella, G.; Petrizzo, M.; della Volpe, E.; Orlando, R.; Giugliano, D.; Esposito, K. Circulating
endothelial progenitor cells in type 1 diabetic patients with erectile dysfunction. Endocrine 2015, 49, 415�421.
[CrossRef] [PubMed]
61. Bahadoran, Z.; Golzarand, M.; Mirmiran, P.; Shiva, N.; Azizi, F. Dietary total antioxidant capacity and the
occurrence of metabolic syndrome and its components after a 3-year follow-up in adults: Tehran Lipid and
Glucose Study. Nutr. Metab. 2012, 9, 70. [CrossRef] [PubMed]
62. Chrysohoou, C.; Esposito, K.; Giugliano, D.; Panagiotakos, D.B. Peripheral Arterial Disease and
Cardiovascular Risk: The Role of Mediterranean Diet. Angiology 2015, 66, 708�710. [CrossRef] [PubMed]
63. De la Iglesia, R.; Lopez-Legarrea, P.; Celada, P.; Sanchez-Muniz, F.J.; Martinez, J.A.; Zulet, M.A. Beneficial
effects of the RESMENA dietary pattern on oxidative stress in patients suffering from metabolic syndrome
with hyperglycemia are associated to dietary TAC and fruit consumption. Int. J. Mol. Sci. 2013, 14, 6903�6919.
[CrossRef] [PubMed]
64. Lopez-Legarrea, P.; de la Iglesia, R.; Abete, I.; Bondia-Pons, I.; Navas-Carretero, S.; Forga, L.; Martinez, J.A.;
Zulet, M.A. Short-term role of the dietary total antioxidant capacity in two hypocaloric regimes on obese
with metabolic syndrome symptoms: The RESMENA randomized controlled trial. Nutr. Metab. 2013, 10, 22.
[CrossRef] [PubMed]
65. Puchau, B.; Zulet, M.A.; de Echavarri, A.G.; Hermsdorff, H.H.; Martinez, J.A. Dietary total antioxidant
capacity is negatively associated with some metabolic syndrome features in healthy young adults. Nutrition
2010, 26, 534�541. [CrossRef] [PubMed]
66. World Health Organization. Obesity: Preventing and Managing the Global Epidemic; Report of a WHO
Consultation; World Health Organization Technical Report Series; WHO: Geneva, Switzerland, 2000.
67. Tapsell, L.C.; Hemphill, I.; Cobiac, L.; Patch, C.S.; Sullivan, D.R.; Fenech, M.; Roodenrys, S.; Keogh, J.B.;
Clifton, P.M.; Williams, P.G.; et al. Health benefits of herbs and spices: The past, the present, the future.
Med. J. Aust. 2006, 185, S4�S24. [PubMed]
68. Abete, I.; Astrup, A.; Martinez, J.A.; Thorsdottir, I.; Zulet, M.A. Obesity and the metabolic syndrome: Role of
different dietary macronutrient distribution patterns and specific nutritional components on weight loss and
maintenance. Nutr. Rev. 2010, 68, 214�231. [CrossRef] [PubMed]
69. Ebbeling, C.B.; Swain, J.F.; Feldman, H.A.; Wong, W.W.; Hachey, D.L.; Garcia-Lago, E.; Ludwig, D.S. Effects
of dietary composition on energy expenditure during weight-loss maintenance. JAMA 2012, 307, 2627�2634.
[CrossRef] [PubMed]
70. Abete, I.; Goyenechea, E.; Zulet, M.A.; Martinez, J.A. Obesity and metabolic syndrome: Potential benefit
from specific nutritional components. Nutr. Metab. Cardiovasc. Dis. 2011, 21, B1�B15. [CrossRef] [PubMed]
71. Arciero, P.J.; Ormsbee, M.J.; Gentile, C.L.; Nindl, B.C.; Brestoff, J.R.; Ruby, M. Increased protein intake and
meal frequency reduces abdominal fat during energy balance and energy deficit. Obesity 2013, 21, 1357�1366.
[CrossRef] [PubMed]
72. Wikarek, T.; Chudek, J.; Owczarek, A.; Olszanecka-Glinianowicz, M. Effect of dietary macronutrients on
postprandial incretin hormone release and satiety in obese and normal-weight women. Br. J. Nutr. 2014, 111,
236�246. [CrossRef] [PubMed]
73. Bray, G.A.; Smith, S.R.; de Jonge, L.; Xie, H.; Rood, J.; Martin, C.K.; Most, M.; Brock, C.; Mancuso, S.;
Redman, L.M. Effect of dietary protein content on weight gain, energy expenditure, and body composition
during overeating: A randomized controlled trial. JAMA 2012, 307, 47�55. [CrossRef] [PubMed]
74. Westerterp-Plantenga, M.S.; Nieuwenhuizen, A.; Tome, D.; Soenen, S.; Westerterp, K.R. Dietary protein,
weight loss, and weight maintenance. Annu. Rev. Nutr. 2009, 29, 21�41. [CrossRef] [PubMed]
75. Koppes, L.L.; Boon, N.; Nooyens, A.C.; van Mechelen, W.; Saris, W.H. Macronutrient distribution over
a period of 23 years in relation to energy intake and body fatness. Br. J. Nutr. 2009, 101, 108�115. [CrossRef]
[PubMed]
76. De Jonge, L.; Bray, G.A.; Smith, S.R.; Ryan, D.H.; de Souza, R.J.; Loria, C.M.; Champagne, C.M.;
Williamson, D.A.; Sacks, F.M. Effect of diet composition and weight loss on resting energy expenditure in
the POUNDS LOST study. Obesity 2012, 20, 2384�2389. [CrossRef] [PubMed]
77. Stocks, T.; Angquist, L.; Hager, J.; Charon, C.; Holst, C.; Martinez, J.A.; Saris, W.H.; Astrup, A.; Sorensen, T.I.;
Larsen, L.H. TFAP2B-dietary protein and glycemic index interactions and weight maintenance after weight
loss in the DiOGenes trial. Hum. Hered. 2013, 75, 213�219. [CrossRef] [PubMed]
78. Giugliano, D.; Maiorino, M.I.; Esposito, K. Linking prediabetes and cancer: A complex issue. Diabetologia
2015, 58, 201�202. [CrossRef] [PubMed]
79. Bendtsen, L.Q.; Lorenzen, J.K.; Bendsen, N.T.; Rasmussen, C.; Astrup, A. Effect of dairy proteins on appetite,
energy expenditure, body weight, and composition: A review of the evidence from controlled clinical trials.
Adv. Nutr. 2013, 4, 418�438. [CrossRef] [PubMed]
80. Heer, M.; Egert, S. Nutrients other than carbohydrates: Their effects on glucose homeostasis in humans.
Diabetes Metab. Res. Rev. 2015, 31, 14�35. [CrossRef] [PubMed]
81. Layman, D.K.; Evans, E.M.; Erickson, D.; Seyler, J.; Weber, J.; Bagshaw, D.; Griel, A.; Psota, T.; Kris-Etherton, P.
A moderate-protein diet produces sustained weight loss and long-term changes in body composition and
blood lipids in obese adults. J. Nutr. 2009, 139, 514�521. [CrossRef] [PubMed]
82. Pedersen, A.N.; Kondrup, J.; Borsheim, E. Health effects of protein intake in healthy adults: A systematic
literature review. Food Nutr. Res. 2013, 57, 21245. [CrossRef] [PubMed]
83. Daly, R.M.; O�Connell, S.L.; Mundell, N.L.; Grimes, C.A.; Dunstan, D.W.; Nowson, C.A. Protein-enriched
diet, with the use of lean red meat, combined with progressive resistance training enhances lean tissue mass
and muscle strength and reduces circulating IL-6 concentrations in elderly women: A cluster randomized
controlled trial. Am. J. Clin. Nutr. 2014, 99, 899�910. [CrossRef] [PubMed]
84. Arciero, P.J.; Gentile, C.L.; Pressman, R.; Everett, M.; Ormsbee, M.J.; Martin, J.; Santamore, J.; Gorman, L.;
Fehling, P.C.; Vukovich, M.D.; et al. Moderate protein intake improves total and regional body composition
and insulin sensitivity in overweight adults. Metab. Clin. Exp. 2008, 57, 757�765. [CrossRef] [PubMed]
85. Gregory, S.M.; Headley, S.A.; Wood, R.J. Effects of dietary macronutrient distribution on vascular integrity in
obesity and metabolic syndrome. Nutr. Rev. 2011, 69, 509�519. [CrossRef] [PubMed]
86. Consenso FESNAD-SEEDO. Recomendaciones nutricionales basadas en la evidencia para la prevenci�n y el
tratamiento del sobrepeso y la obesidad en adultos (Consenso FESNAD-SEEDO). Rev. Esp. Obes. 2011, 10, 36.
87. Jakubowicz, D.; Froy, O.; Wainstein, J.; Boaz, M. Meal timing and composition influence ghrelin levels,
appetite scores and weight loss maintenance in overweight and obese adults. Steroids 2012, 77, 323�331.
[CrossRef] [PubMed]
88. Schwarz, N.A.; Rigby, B.R.; La Bounty, P.; Shelmadine, B.; Bowden, R.G. A review of weight control strategies
and their effects on the regulation of hormonal balance. J. Nutr. Metab. 2011, 2011, 237932. [CrossRef]
[PubMed]
89. Ohkawara, K.; Cornier, M.A.; Kohrt, W.M.; Melanson, E.L. Effects of increased meal frequency on fat
oxidation and perceived hunger. Obesity 2013, 21, 336�343. [CrossRef] [PubMed]
90. Ekmekcioglu, C.; Touitou, Y. Chronobiological aspects of food intake and metabolism and their relevance on
energy balance and weight regulation. Obes. Rev. 2011, 12, 14�25. [CrossRef] [PubMed]
91. Lioret, S.; Touvier, M.; Lafay, L.; Volatier, J.L.; Maire, B. Are eating occasions and their energy content related
to child overweight and socioeconomic status? Obesity 2008, 16, 2518�2523. [CrossRef] [PubMed]
92. Bhutani, S.; Varady, K.A. Nibbling versus feasting: Which meal pattern is better for heart disease prevention?
Nutr. Rev. 2009, 67, 591�598. [CrossRef] [PubMed]
93. Leidy, H.J.; Tang, M.; Armstrong, C.L.; Martin, C.B.; Campbell, W.W. The effects of consuming frequent,
higher protein meals on appetite and satiety during weight loss in overweight/obese men. Obesity 2011, 19,
818�824. [CrossRef] [PubMed]
94. Mills, J.P.; Perry, C.D.; Reicks, M. Eating frequency is associated with energy intake but not obesity in midlife
women. Obesity 2011, 19, 552�559. [CrossRef] [PubMed]
95. Cameron, J.D.; Cyr, M.J.; Doucet, E. Increased meal frequency does not promote greater weight loss in subjects
who were prescribed an 8-week equi-energetic energy-restricted diet. Br. J. Nutr. 2010, 103, 1098�1101.
[CrossRef] [PubMed]
96. Smeets, A.J.; Lejeune, M.P.; Westerterp-Plantenga, M.S. Effects of oral fat perception by modified sham
feeding on energy expenditure, hormones and appetite profile in the postprandial state. Br. J. Nutr. 2009,
101, 1360�1368. [CrossRef] [PubMed]
97. Taylor, M.A.; Garrow, J.S. Compared with nibbling, neither gorging nor a morning fast affect short-term
energy balance in obese patients in a chamber calorimeter. Int. J. Obes. Relat. Metab. Disord. 2001, 25, 519�528.
[CrossRef] [PubMed]
98. Smeets, A.J.; Westerterp-Plantenga, M.S. Acute effects on metabolism and appetite profile of one meal
difference in the lower range of meal frequency. Br. J. Nutr. 2008, 99, 1316�1321. [CrossRef] [PubMed]
99. Heden, T.D.; LeCheminant, J.D.; Smith, J.D. Influence of weight classification on walking and jogging energy
expenditure prediction in women. Res. Q. Exerc. Sport 2012, 83, 391�399. [CrossRef] [PubMed]
100. Bachman, J.L.; Raynor, H.A. Effects of manipulating eating frequency during a behavioral weight loss
intervention: A pilot randomized controlled trial. Obesity 2012, 20, 985�992. [CrossRef] [PubMed]
101. Perrigue, M.M.; Drewnowski, A.; Wang, C.Y.; Neuhouser, M.L. Higher Eating Frequency Does Not Decrease
Appetite in Healthy Adults. J. Nutr. 2016, 146, 59�64. [CrossRef] [PubMed]
102. Keys, A. Coronary heart disease in seven countries. 1970. Nutrition 1997, 13, 249�253. [CrossRef]
103. Keys, A.; Menotti, A.; Aravanis, C.; Blackburn, H.; Djordevic, B.S.; Buzina, R.; Dontas, A.S.; Fidanza, F.;
Karvonen, M.J.; Kimura, N.; et al. The seven countries study: 2289 deaths in 15 years. Prev. Med. 1984, 13,
141�154. [CrossRef]
104. Davis, C.; Bryan, J.; Hodgson, J.; Murphy, K. Definition of the Mediterranean Diet; a Literature Review.
Nutrients 2015, 7, 9139�9153. [CrossRef] [PubMed]
105. Sofi, F.; Macchi, C.; Abbate, R.; Gensini, G.F.; Casini, A. Mediterranean diet and health status: An updated
meta-analysis and a proposal for a literature-based adherence score. Public Health Nutr. 2014, 17, 2769�2782.
[CrossRef] [PubMed]
106. Mayneris-Perxachs, J.; Sala-Vila, A.; Chisaguano, M.; Castellote, A.I.; Estruch, R.; Covas, M.I.; Fito, M.;
Salas-Salvado, J.; Martinez-Gonzalez, M.A.; Lamuela-Raventos, R.; et al. Effects of 1-year intervention with
a Mediterranean diet on plasma fatty acid composition and metabolic syndrome in a population at high
cardiovascular risk. PLoS ONE 2014, 9, e85202. [CrossRef] [PubMed]
107. Esposito, K.; Maiorino, M.I.; Bellastella, G.; Chiodini, P.; Panagiotakos, D.; Giugliano, D. A journey
into a Mediterranean diet and type 2 diabetes: A systematic review with meta-analyses. BMJ Open
2015, 5, e008222. [CrossRef] [PubMed]
108. Kastorini, C.M.; Milionis, H.J.; Esposito, K.; Giugliano, D.; Goudevenos, J.A.; Panagiotakos, D.B. The effect of
Mediterranean diet on metabolic syndrome and its components: A meta-analysis of 50 studies and 534,906
individuals. J. Am. Coll. Cardiol. 2011, 57, 1299�1313. [CrossRef] [PubMed]
109. Schwingshackl, L.; Missbach, B.; Konig, J.; Hoffmann, G. Adherence to a Mediterranean diet and risk of
diabetes: A systematic review and meta-analysis. Public Health Nutr. 2015, 18, 1292�1299. [CrossRef]
[PubMed]
110. Koloverou, E.; Esposito, K.; Giugliano, D.; Panagiotakos, D. The effect of Mediterranean diet on the
development of type 2 diabetes mellitus: A meta-analysis of 10 prospective studies and 136,846 participants.
Metab. Clin. Exp. 2014, 63, 903�911. [CrossRef] [PubMed]
111. Salas-Salvado, J.; Garcia-Arellano, A.; Estruch, R.; Marquez-Sandoval, F.; Corella, D.; Fiol, M.;
Gomez-Gracia, E.; Vinoles, E.; Aros, F.; Herrera, C.; et al. Components of the Mediterranean-type food
pattern and serum inflammatory markers among patients at high risk for cardiovascular disease. Eur. J.
Clin. Nutr. 2008, 62, 651�659. [CrossRef] [PubMed]
112. Martinez-Gonzalez, M.A.; Garcia-Lopez, M.; Bes-Rastrollo, M.; Toledo, E.; Martinez-Lapiscina, E.H.;
Delgado-Rodriguez, M.; Vazquez, Z.; Benito, S.; Beunza, J.J. Mediterranean diet and the incidence of
cardiovascular disease: A Spanish cohort. Nutr. Metab. Cardiovasc. Dis. 2011, 21, 237�244. [CrossRef]
[PubMed]
113. Fito, M.; Estruch, R.; Salas-Salvado, J.; Martinez-Gonzalez, M.A.; Aros, F.; Vila, J.; Corella, D.; Diaz, O.;
Saez, G.; de la Torre, R.; et al. Effect of the Mediterranean diet on heart failure biomarkers: A randomized
sample from the PREDIMED trial. Eur. J. Heart Fail. 2014, 16, 543�550. [CrossRef] [PubMed]
114. Estruch, R.; Ros, E.; Salas-Salvado, J.; Covas, M.I.; Corella, D.; Aros, F.; Gomez-Gracia, E.; Ruiz-Gutierrez, V.;
Fiol, M.; Lapetra, J.; et al. Primary prevention of cardiovascular disease with a Mediterranean diet. N. Engl.
J. Med. 2013, 368, 1279�1290. [CrossRef] [PubMed]
115. Serra-Majem, L.; Roman, B.; Estruch, R. Scientific evidence of interventions using the Mediterranean diet:
A systematic review. Nutr. Rev. 2006, 64, S27�S47. [CrossRef] [PubMed]
116. Esposito, K.; Kastorini, C.M.; Panagiotakos, D.B.; Giugliano, D. Mediterranean diet and weight loss:
Meta-analysis of randomized controlled trials. Metab. Syndr. Relat. Disord. 2011, 9, 1�12. [CrossRef]
[PubMed]
117. Razquin, C.; Martinez, J.A.; Martinez-Gonzalez, M.A.; Mitjavila, M.T.; Estruch, R.; Marti, A. A 3 years
follow-up of a Mediterranean diet rich in virgin olive oil is associated with high plasma antioxidant capacity
and reduced body weight gain. Eur. J. Clin. Nutr. 2009, 63, 1387�1393. [CrossRef] [PubMed]
118. Bertoli, S.; Spadafranca, A.; Bes-Rastrollo, M.; Martinez-Gonzalez, M.A.; Ponissi, V.; Beggio, V.; Leone, A.;
Battezzati, A. Adherence to the Mediterranean diet is inversely related to binge eating disorder in patients
seeking a weight loss program. Clin. Nutr. 2015, 34, 107�114. [CrossRef] [PubMed]
119. Rios-Hoyo, A.; Cortes, M.J.; Rios-Ontiveros, H.; Meaney, E.; Ceballos, G.; Gutierrez-Salmean, G. Obesity,
Metabolic Syndrome, and Dietary Therapeutical Approaches with a Special Focus on Nutraceuticals
(Polyphenols): A Mini-Review. Int. J. Vitam. Nutr. Res. 2014, 84, 113�123. [CrossRef] [PubMed]
120. Juraschek, S.P.; Guallar, E.; Appel, L.J.; Miller, E.R., 3rd. Effects of vitamin C supplementation on blood
pressure: A meta-analysis of randomized controlled trials. Am. J. Clin. Nutr. 2012, 95, 1079�1088. [CrossRef]
[PubMed]
121. Michels, A.J.; Frei, B. Myths, artifacts, and fatal flaws: Identifying limitations and opportunities in vitamin C
research. Nutrients 2013, 5, 5161�5192. [CrossRef] [PubMed]
122. Frei, B.; Birlouez-Aragon, I.; Lykkesfeldt, J. Authors� perspective: What is the optimum intake of vitamin C
in humans? Crit. Rev. Food Sci. Nutr. 2012, 52, 815�829. [CrossRef] [PubMed]
123. Mason, S.A.; della Gatta, P.A.; Snow, R.J.; Russell, A.P.; Wadley, G.D. Ascorbic acid supplementation
improves skeletal muscle oxidative stress and insulin sensitivity in people with type 2 diabetes: Findings of
a randomized controlled study. Free Radic. Biol. Med. 2016, 93, 227�238. [CrossRef] [PubMed]
124. Chambial, S.; Dwivedi, S.; Shukla, K.K.; John, P.J.; Sharma, P. Vitamin C in Disease Prevention and Cure:
An Overview. Indian J. Clin. Biochem. 2013, 28, 314�328. [CrossRef] [PubMed]
125. Block, G.; Jensen, C.D.; Dalvi, T.B.; Norkus, E.P.; Hudes, M.; Crawford, P.B.; Holland, N.; Fung, E.B.;
Schumacher, L.; Harmatz, P. Vitamin C treatment reduces elevated C-reactive protein. Free Radic. Biol. Med.
2009, 46, 70�77. [CrossRef] [PubMed]
126. Ashor, A.W.; Siervo, M.; Lara, J.; Oggioni, C.; Afshar, S.; Mathers, J.C. Effect of vitamin C and vitamin E
supplementation on endothelial function: A systematic review and meta-analysis of randomised controlled
trials. Br. J. Nutr. 2015, 113, 1182�1194. [CrossRef] [PubMed]
127. Kim, S.M.; Lim, S.M.; Yoo, J.A.; Woo, M.J.; Cho, K.H. Consumption of high-dose vitamin C (1250 mg
per day) enhances functional and structural properties of serum lipoprotein to improve anti-oxidant,
anti-atherosclerotic, and anti-aging effects via regulation of anti-inflammatory microRNA. Food Funct.
2015, 6, 3604�3612. [CrossRef] [PubMed]
128. Monfared, S.; Larijani, B.; Abdollahi, M. Islet transplantation and antioxidant management: A comprehensive
review. World J. Gastroenterol. 2009, 15, 1153�1161. [CrossRef]
129. German Nutrition Society (DGE). New Reference Values for Vitamin C Intake. Ann. Nutr. Metab. 2015,
67, 13�20.
130. Mamede, A.C.; Tavares, S.D.; Abrantes, A.M.; Trindade, J.; Maia, J.M.; Botelho, M.F. The role of vitamins in
cancer: A review. Nutr. Cancer 2011, 63, 479�494. [CrossRef] [PubMed]
131. Moser, M.A.; Chun, O.K. Vitamin C and Heart Health: A Review Based on Findings from Epidemiologic
Studies. Int. J. Mol. Sci. 2016, 17, 1328. [CrossRef] [PubMed]
132. Vilaplana-Perez, C.; Aunon, D.; Garcia-Flores, L.A.; Gil-Izquierdo, A. Hydroxytyrosol and potential uses in
cardiovascular diseases, cancer, and AIDS. Front. Nutr. 2014, 1, 18. [PubMed]
133. Achmon, Y.; Fishman, A. The antioxidant hydroxytyrosol: Biotechnological production challenges and
opportunities. Appl. Microbiol. Biotechnol. 2015, 99, 1119�1130. [CrossRef] [PubMed]
134. Bulotta, S.; Celano, M.; Lepore, S.M.; Montalcini, T.; Pujia, A.; Russo, D. Beneficial effects of the olive
oil phenolic components oleuropein and hydroxytyrosol: Focus on protection against cardiovascular and
metabolic diseases. J. Transl. Med. 2014, 12, 219. [CrossRef] [PubMed]
135. EFSA NDA Panel (EFSA Panel on Dietetic Products, Nutrition and Allergies). Scientific Opinion on the
substantiation of health claims related to polyphenols in olive and protection of LDL particles from oxidative
damage (ID 1333, 1638, 1639, 1696, 2865), maintenance of normal blood HDL cholesterol concentrations
(ID 1639). EFSA J. 2011, 9, 2033�2058.
136. Scoditti, E.; Nestola, A.; Massaro, M.; Calabriso, N.; Storelli, C.; De Caterina, R.; Carluccio, M.A.
Hydroxytyrosol suppresses MMP-9 and COX-2 activity and expression in activated human monocytes
via PKCalpha and PKCbeta1 inhibition. Atherosclerosis 2014, 232, 17�24. [CrossRef] [PubMed]
137. Giordano, E.; Dangles, O.; Rakotomanomana, N.; Baracchini, S.; Visioli, F. 3-O-Hydroxytyrosol glucuronide
and 4-O-hydroxytyrosol glucuronide reduce endoplasmic reticulum stress in vitro. Food Funct. 2015, 6,
3275�3281. [CrossRef] [PubMed]
138. Granados-Principal, S.; Quiles, J.L.; Ramirez-Tortosa, C.L.; Sanchez-Rovira, P.; Ramirez-Tortosa, M.C.
Hydroxytyrosol: From laboratory investigations to future clinical trials. Nutr. Rev. 2010, 68, 191�206.
[CrossRef] [PubMed]
139. Carluccio, M.A.; Siculella, L.; Ancora, M.A.; Massaro, M.; Scoditti, E.; Storelli, C.; Visioli, F.;
Distante, A.; De Caterina, R. Olive oil and red wine antioxidant polyphenols inhibit endothelial activation:
Antiatherogenic properties of Mediterranean diet phytochemicals. Arterioscler. Thromb. Vasc. Biol. 2003, 23,
622�629. [CrossRef] [PubMed]
140. Visioli, F.; Bernardini, E. Extra virgin olive oil�s polyphenols: Biological activities. Curr. Pharm. Des. 2011, 17,
786�804. [CrossRef] [PubMed]
141. Nabavi, S.F.; Russo, G.L.; Daglia, M.; Nabavi, S.M. Role of quercetin as an alternative for obesity treatment:
You are what you eat! Food Chem. 2015, 179, 305�310. [CrossRef] [PubMed]
142. Vinayagam, R.; Xu, B. Antidiabetic properties of dietary flavonoids: A cellular mechanism review.
Nutr. Metab. 2015, 12, 60. [CrossRef] [PubMed]
143. Shibata, T.; Nakashima, F.; Honda, K.; Lu, Y.J.; Kondo, T.; Ushida, Y.; Aizawa, K.; Suganuma, H.; Oe, S.;
Tanaka, H.; et al. Toll-like receptors as a target of food-derived anti-inflammatory compounds. J. Biol. Chem.
2014, 289, 32757�32772. [CrossRef] [PubMed]
144. Ahn, J.; Lee, H.; Kim, S.; Park, J.; Ha, T. The anti-obesity effect of quercetin is mediated by the AMPK and
MAPK signaling pathways. Biochem. Biophys. Res. Commun. 2008, 373, 545�549. [CrossRef] [PubMed]
145. Fang, X.K.; Gao, J.; Zhu, D.N. Kaempferol and quercetin isolated from Euonymus alatus improve glucose
uptake of 3T3-L1 cells without adipogenesis activity. Life Sci. 2008, 82, 615�622. [CrossRef] [PubMed]
146. Clark, J.L.; Zahradka, P.; Taylor, C.G. Efficacy of flavonoids in the management of high blood pressure.
Nutr. Rev. 2015, 73, 799�822. [CrossRef] [PubMed]
147. D�Andrea, G. Quercetin: A flavonol with multifaceted therapeutic applications? Fitoterapia 2015, 106, 256�271.
[CrossRef] [PubMed]
148. Larson, A.; Witman, M.A.; Guo, Y.; Ives, S.; Richardson, R.S.; Bruno, R.S.; Jalili, T.; Symons, J.D. Acute,
quercetin-induced reductions in blood pressure in hypertensive individuals are not secondary to lower
plasma angiotensin-converting enzyme activity or endothelin-1: Nitric oxide. Nutr. Res. 2012, 32, 557�564.
[CrossRef] [PubMed]
149. Tome-Carneiro, J.; Gonzalvez, M.; Larrosa, M.; Yanez-Gascon, M.J.; Garcia-Almagro, F.J.; Ruiz-Ros, J.A.;
Tomas-Barberan, F.A.; Garcia-Conesa, M.T.; Espin, J.C. Resveratrol in primary and secondary prevention of
cardiovascular disease: A dietary and clinical perspective. Ann. N. Y. Acad. Sci. 2013, 1290, 37�51. [CrossRef]
[PubMed]
150. Leonard, S.S.; Xia, C.; Jiang, B.H.; Stinefelt, B.; Klandorf, H.; Harris, G.K.; Shi, X. Resveratrol scavenges
reactive oxygen species and effects radical-induced cellular responses. Biochem. Biophys. Res. Commun. 2003,
309, 1017�1026. [CrossRef] [PubMed]
151. Ren, Z.; Wang, L.; Cui, J.; Huoc, Z.; Xue, J.; Cui, H.; Mao, Q.; Yang, R. Resveratrol inhibits NF-?B signaling
through suppression of p65 and I?B kinase activities. Die Pharm. 2013, 68, 689�694.
152. Latruffe, N.; Lancon, A.; Frazzi, R.; Aires, V.; Delmas, D.; Michaille, J.J.; Djouadi, F.; Bastin, J.;
Cherkaoui-Malki, M. Exploring new ways of regulation by resveratrol involving miRNAs, with emphasis on
inflammation. Ann. N. Y. Acad. Sci. 2015, 1348, 97�106. [CrossRef] [PubMed]
153. Hausenblas, H.A.; Schoulda, J.A.; Smoliga, J.M. Resveratrol treatment as an adjunct to pharmacological
management in type 2 diabetes mellitus�Systematic review and meta-analysis. Mol. Nutr. Food Res. 2015,
59, 147�159. [CrossRef] [PubMed]
154. Liu, K.; Zhou, R.; Wang, B.; Mi, M.T. Effect of resveratrol on glucose control and insulin sensitivity:
A meta-analysis of 11 randomized controlled trials. Am. J. Clin. Nutr. 2014, 99, 1510�1519. [CrossRef]
[PubMed]
155. Bitterman, J.L.; Chung, J.H. Metabolic effects of resveratrol: Addressing the controversies. Cell. Mol. Life Sci.
2015, 72, 1473�1488. [CrossRef] [PubMed]
156. Han, S.; Park, J.S.; Lee, S.; Jeong, A.L.; Oh, K.S.; Ka, H.I.; Choi, H.J.; Son, W.C.; Lee, W.Y.; Oh, S.J.; et al.
CTRP1 protects against diet-induced hyperglycemia by enhancing glycolysis and fatty acid oxidation.
J. Nutr. Biochem. 2016, 27, 43�52. [CrossRef] [PubMed]
157. Gambini, J.; Ingles, M.; Olaso, G.; Lopez-Grueso, R.; Bonet-Costa, V.; Gimeno-Mallench, L.; Mas-Bargues, C.;
Abdelaziz, K.M.; Gomez-Cabrera, M.C.; Vina, J.; et al. Properties of Resveratrol: In Vitro and In Vivo
Studies about Metabolism, Bioavailability, and Biological Effects in Animal Models and Humans. Oxid. Med.
Cell. Longev. 2015, 2015, 837042. [CrossRef] [PubMed]
158. Yang, C.S.; Suh, N. Cancer prevention by different forms of tocopherols. Top. Curr. Chem. 2013, 329, 21�33.
[PubMed]
159. Jiang, Q. Natural forms of vitamin E: Metabolism, antioxidant, and anti-inflammatory activities and their
role in disease prevention and therapy. Free Radic. Biol. Med. 2014, 72, 76�90. [CrossRef] [PubMed]
160. Witting, P.K.; Upston, J.M.; Stocker, R. The molecular action of alpha-tocopherol in lipoprotein lipid
peroxidation. Pro- and antioxidant activity of vitamin E in complex heterogeneous lipid emulsions.
In Fat-Soluble Vitamins; Quinn, P.J., Kagan, V.E., Eds.; Springer: New York, NY, USA; pp. 345�390.
161. Saboori, S.; Shab-Bidar, S.; Speakman, J.R.; Yousefi Rad, E.; Djafarian, K. Effect of vitamin E supplementation
on serum C-reactive protein level: A meta-analysis of randomized controlled trials. Eur. J. Clin. Nutr. 2015,
69, 867�873. [CrossRef] [PubMed]
162. Azzi, A.; Meydani, S.N.; Meydani, M.; Zingg, J.M. The rise, the fall and the renaissance of vitamin E.
Arch. Biochem. Biophys. 2016, 595, 100�108. [CrossRef] [PubMed]
163. Raederstorff, D.; Wyss, A.; Calder, P.C.; Weber, P.; Eggersdorfer, M. Vitamin E function and requirements in
relation to PUFA. Br. J. Nutr. 2015, 114, 1113�1122. [CrossRef] [PubMed]
164. Loffredo, L.; Perri, L.; Di Castelnuovo, A.; Iacoviello, L.; De Gaetano, G.; Violi, F. Supplementation
with vitamin E alone is associated with reduced myocardial infarction: A meta-analysis. Nutr. Metab.
Cardiovasc. Dis. 2015, 25, 354�363. [CrossRef] [PubMed]
165. Giampieri, F.; Tulipani, S.; Alvarez-Suarez, J.M.; Quiles, J.L.; Mezzetti, B.; Battino, M. The strawberry:
Composition, nutritional quality, and impact on human health. Nutrition 2012, 28, 9�19. [CrossRef] [PubMed]
166. Amiot, M.J.; Riva, C.; Vinet, A. Effects of dietary polyphenols on metabolic syndrome features in humans:
A systematic review. Obes. Rev. 2016, 17, 573�586. [CrossRef] [PubMed]
167. Smeriglio, A.; Barreca, D.; Bellocco, E.; Trombetta, D. Chemistry, Pharmacology and Health Benefits of
Anthocyanins. Phytother. Res. 2016, 30, 1265�1286. [CrossRef] [PubMed]
168. Lila, M.A. Anthocyanins and Human Health: An In Vitro Investigative Approach. J. Biomed. Biotechnol. 2004,
2004, 306�313. [CrossRef] [PubMed]
169. Stull, A.J.; Cash, K.C.; Johnson, W.D.; Champagne, C.M.; Cefalu, W.T. Bioactives in blueberries improve
insulin sensitivity in obese, insulin-resistant men and women. J. Nutr. 2010, 140, 1764�1768. [CrossRef]
[PubMed]
170. Zhu, Y.; Xia, M.; Yang, Y.; Liu, F.; Li, Z.; Hao, Y.; Mi, M.; Jin, T.; Ling, W. Purified anthocyanin supplementation
improves endothelial function via NO-cGMP activation in hypercholesterolemic individuals. Clin. Chem.
2011, 57, 1524�1533. [CrossRef] [PubMed]
171. Qin, Y.; Xia, M.; Ma, J.; Hao, Y.; Liu, J.; Mou, H.; Cao, L.; Ling, W. Anthocyanin supplementation improves
serum LDL- and HDL-cholesterol concentrations associated with the inhibition of cholesteryl ester transfer
protein in dyslipidemic subjects. Am. J. Clin. Nutr. 2009, 90, 485�492. [CrossRef] [PubMed]
172. Zhu, Y.; Ling, W.; Guo, H.; Song, F.; Ye, Q.; Zou, T.; Li, D.; Zhang, Y.; Li, G.; Xiao, Y.; et al. Anti-inflammatory
effect of purified dietary anthocyanin in adults with hypercholesterolemia: A randomized controlled trial.
Nutr. Metab. Cardiovasc. Dis. 2013, 23, 843�849. [CrossRef] [PubMed]
173. Zhu, Y.; Huang, X.; Zhang, Y.; Wang, Y.; Liu, Y.; Sun, R.; Xia, M. Anthocyanin supplementation
improves HDL-associated paraoxonase 1 activity and enhances cholesterol efflux capacity in subjects
with hypercholesterolemia. J. Clin. Endocrinol. Metab. 2014, 99, 561�569. [CrossRef] [PubMed]
174. Karlsen, A.; Retterstol, L.; Laake, P.; Paur, I.; Bohn, S.K.; Sandvik, L.; Blomhoff, R. Anthocyanins inhibit
nuclear factor-kappaB activation in monocytes and reduce plasma concentrations of pro-inflammatory
mediators in healthy adults. J. Nutr. 2007, 137, 1951�1954. [PubMed]
175. Keske, M.A.; Ng, H.L.; Premilovac, D.; Rattigan, S.; Kim, J.A.; Munir, K.; Yang, P.; Quon, M.J. Vascular and
metabolic actions of the green tea polyphenol epigallocatechin gallate. Curr. Med. Chem. 2015, 22, 59�69.
[CrossRef] [PubMed]
176. Johnson, R.; Bryant, S.; Huntley, A.L. Green tea and green tea catechin extracts: An overview of the clinical
evidence. Maturitas 2012, 73, 280�287. [CrossRef] [PubMed]
177. Huang, J.; Wang, Y.; Xie, Z.; Zhou, Y.; Zhang, Y.; Wan, X. The anti-obesity effects of green tea in human
intervention and basic molecular studies. Eur. J. Clin. Nutr. 2014, 68, 1075�1087. [CrossRef] [PubMed]
178. Hursel, R.; Westerterp-Plantenga, M.S. Catechin- and caffeine-rich teas for control of body weight in humans.
Am. J. Clin. Nutr. 2013, 98, 1682S�1693S. [CrossRef] [PubMed]
179. Gutierrez-Salmean, G.; Ortiz-Vilchis, P.; Vacaseydel, C.M.; Rubio-Gayosso, I.; Meaney, E.; Villarreal, F.;
Ramirez-Sanchez, I.; Ceballos, G. Acute effects of an oral supplement of (?)-epicatechin on postprandial fat
and carbohydrate metabolism in normal and overweight subjects. Food Funct. 2014, 5, 521�527. [CrossRef]
[PubMed]
180. Khalesi, S.; Sun, J.; Buys, N.; Jamshidi, A.; Nikbakht-Nasrabadi, E.; Khosravi-Boroujeni, H. Green tea
catechins and blood pressure: A systematic review and meta-analysis of randomised controlled trials.
Eur. J. Nutr. 2014, 53, 1299�1311. [CrossRef] [PubMed]


 Rhetoric from the United States government since the early 1990s proclaims that GM foods are no different from their natural counterparts that have existed for centuries. The Food and Drug Administration (FDA) has labeled them �Generally Recognized as Safe,� or GRAS. This status allows a product to be commercialized without any additional testing. According to US law, to be considered GRAS the substance must be the subject of a substantial amount of peer-reviewed published studies (or equivalent) and there must be overwhelming consensus among the scientific community that the product is safe. GM foods had neither. Nonetheless, in a precedent-setting move in 1992 that some experts contend was illegal, the FDA declared that GM crops are GRAS as long as their producers say they are. Thus, the FDA does not require any safety evaluations or labeling of GMOs. A company can even introduce a GM food to the market without telling the agency.
 Taylor�s GMO policy needed to create the impression that unintended effects from GM crops were not an issue. Otherwise their GRAS status would be undermined and they would need the extensive testing and labels that are normally required for food additives. But internal memos made public from a lawsuit showed that the overwhelming consensus among the agency scientists was that GM crops can have unpredictable, hard-to-detect side effects. Various departments and experts spelled these out in detail, listing allergies, toxins, nutritional effects, and new diseases as potential dangers. They urged superiors to require long-term safety studies.5 In spite of the warnings, according to public interest attorney Steven Druker who studied the FDA�s internal files, �References to the unintended negative effects of bioengineering were progressively deleted from drafts of the policy statement (over the protests of agency scientists).�6
 There are several reasons why GM plants present unique dangers. The first is that the process of genetic engineering itself creates unpredicted alterations, irrespective of which gene is transferred. The gene insertion process, for example, is accomplished by either shooting genes from a �gene gun� into a plate of cells, or using bacteria to infect the cell with foreign DNA. Both create mutations in and around the insertion site and elsewhere.13 The �transformed� cell is then cloned into a plant through a process called tissue culture, which results in additional hundreds or thousands of mutations throughout the plants� genome. In the end, the GM plant�s DNA can be a staggering 2-4% different from its natural parent.14 Native genes can be mutated, deleted, or permanently turned on or off. In addition, the insertion process causes holistic and not-well-understood changes among large numbers of native genes. One study revealed that up to 5% of the natural genes altered their levels of protein expression as a result of a single insertion.
 The very first crop submitted to the FDA�s voluntary consultation process, the FlavrSavr tomato, showed evidence of toxins. Out of 20 female rats fed the GM tomato, 7 developed stomach lesions.21 The director of FDA�s Office of Special Research Skills wrote that the tomatoes did not demonstrate a �reasonable certainty of no harm,�22 which is their normal standard of safety. The Additives Evaluation Branch agreed that �unresolved questions still remain.�23 The political appointees, however, did not require that the tomato be withdrawn.1
 GM Diets Cause Liver Damage
 GM Fed Animals Had Higher Death Rates & Organ Damage
 About two dozen farmers reported that their pigs had reproductive problems when fed certain varieties of Bt corn. Pigs were sterile, had false pregnancies, or gave birth to bags of water. Cows and bulls also became sterile. Bt corn was also implicated by farmers in the deaths of cows, horses, water buffaloes, and chickens.55
 Allergic reactions occur when the immune system interprets something as foreign, different, and offensive, and reacts accordingly. All GM foods, by definition, have something foreign and different. And several studies show that they provoke reactions. Rats fed Monsanto�s GM corn, for example, had a significant increase in blood cells related to the immune system.58 GM potatoes caused the immune system of rats to respond more slowly.59 And GM peas provoked an inflammatory response in mice, suggesting that it might cause deadly allergic reactions in people.60
 For years, organic farmers and others have sprayed crops with solutions containing natural Bt bacteria as a method of insect control. The toxin creates holes in their stomach and kills them. Genetic engineers take the gene that produces the toxin in bacteria and insert it into the DNA of crops so that the plant does the work, not the farmer. The fact that we consume that toxic pesticide in every bite of Bt corn is hardly appetizing.
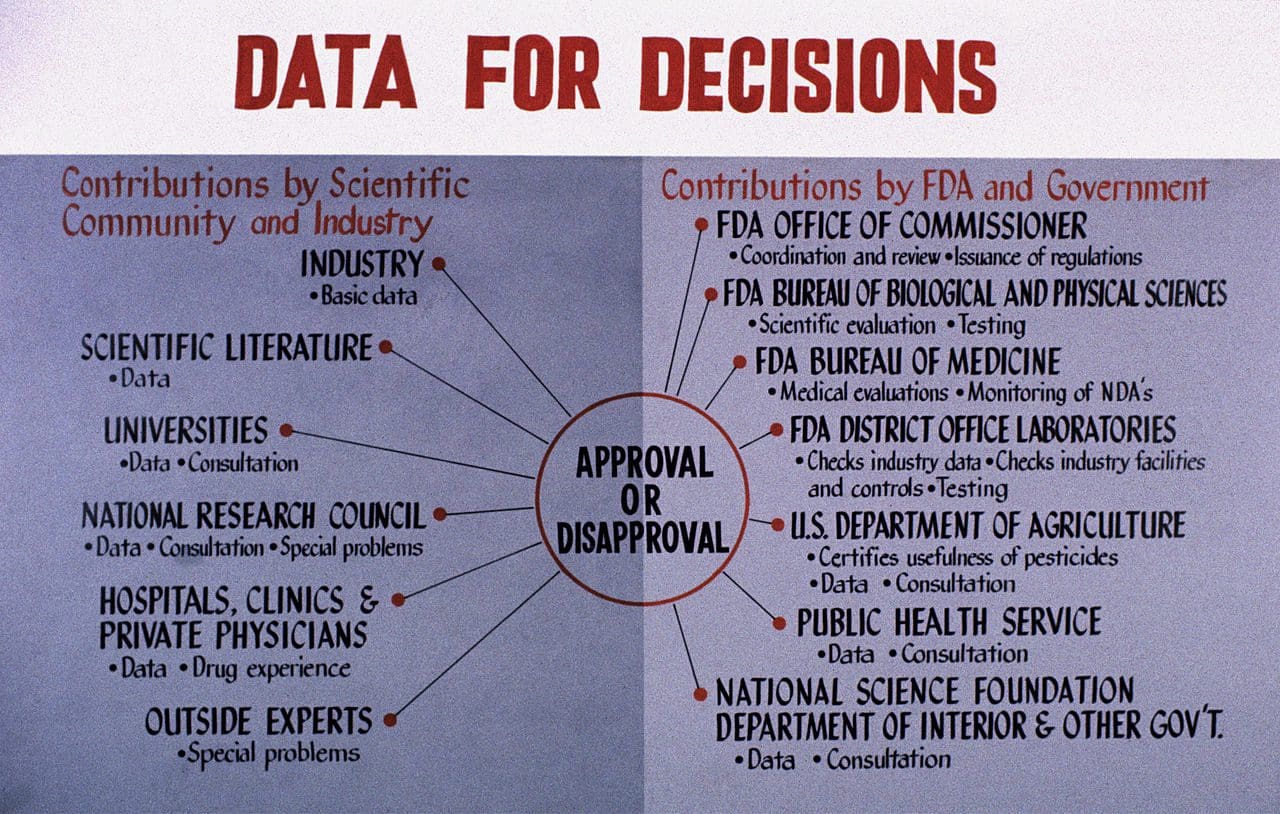 Although the number of safety studies on GM foods is quite small, it has validated the concerns expressed by FDA scientists and others. Unfortunately, government safety assessments worldwide are not competent to even identify most of the potential health problems described above, let alone protect its citizens from the effects.88
 Submissions to the US Food and Drug Administraion (FDA) may be worse than in other countries, since the agency doesn�t actually require any data. Their policy says that biotech companies can determine if their own foods are safe. Anything submitted is voluntary and, according to former Environmental Protection Agency scientist Doug Gurian-Sherman, PhD, �often lack[s] sufficient detail, such as necessary statistical analyses needed for an adequate safety evaluation.� Using Freedom of Information Requests, Dr. Gurian-Sherman analyzed more than a fourth of the data summaries (14 of 53) of GM crops reviewed by the FDA. He says, �The FDA consultation process does not allow the agency to require submission of data, misses obvious errors in company- submitted data summaries, provides insufficient testing guidance, and does not require sufficiently detailed data to enable the FDA to assure that GE crops are safe to eat.�94 Similarly, a Friends of the Earth review of company and FDA documents concluded:
 The unpublished industry studies submitted to regulators are typically kept secret based on the claim that it is �confidential business information.� The Royal Society of Canada is one of many organizations that condemn this practice. They wrote:
 In addition, to relying on untested assumptions, industry-funded research is often designed specifically to force a conclusion of safety. In the high lysine corn described above, for example, the levels of certain nutritional components (i.e. protein content, total dietary fiber, acid detergent fiber, and neutral detergent fiber) were far outside the normal range for corn. Instead of comparing their corn to normal controls, which would reveal this disparity, Monsanto compared it to obscure corn varieties that were also substantially outside the normal range on precisely these values. Thus, their study found no statistical differences by design.
 Monsanto�s 1996 Journal of Nutrition studies on Roundup Ready soybeans107,108 provide plenty of examples of scientific transgressions. Although the study has been used often by the industry as validation for safety claims, experts working in the field were not impressed. For example, Dr. Arpad Pusztai was commissioned at the time by the UK government to lead a 20 member consortium in three institutions to develop rigorous testing protocols on GM foods�protocols that were never implemented. Dr. Pusztai, who had published several studies in that same nutrition journal, said the Monsanto paper was not �up to the normal journal standards.� He said, �It was obvious that the study had been designed to avoid finding any problems. Everybody in our consortium knew this.� Some of the flaws include:
 When governments fail in their duty to keep corporations in check, the �protector� role should shift to the media, which acts as a watchdog to expose public dangers and governmental shortcomings. But mainstream media around the world has largely overlooked the serious problems associated with GM crops and their regulation. The reason for this oversight is varied and includes contributions from an aggressive public relations and disinformation campaign by the biotech industry, legal threats by biotech companies, and in some cases, the fear of losing advertising accounts. This last reason is particularly prevalent among the farm press, which receives much of its income from the biotech industry.
 One of the most troubling aspects of the biotech debate is the attack strategy used on GMO critics and independent scientists. Not only are adverse findings by independent scientists often suppressed, ignored, or denied, researchers that discover problems from GM foods have been fired, stripped of responsibilities, deprived of tenure, and even threatened. Consider Dr. Pusztai, the world�s leading scientist in his field, who inadvertently discovered in 1998 that unpredictable changes in GM crops caused massive damage in rats. He went public with his concerns, was a hero at his prestigious institute for two days, and then, after the director received two phone calls allegedly from the UK Prime Minister�s office, was fired after 35 years and silenced with threats of a lawsuit. False statements were circulated to trash his reputation, which are recited by GMO advocates today.
 Since GM foods are not properly tested before they enter the market, consumers are the guinea pigs. But this doesn�t even qualify as an experiment. There are no controls and no monitoring. Given the mounting of evidence of harm, it is likely that GM foods are contributing to the deterioration of health in the United States, Canada, and other countries where it is consumed. But without post- marketing surveillance, the chances of tracing health problems to GM food are low. The incidence of a disease would have to increase dramatically before it was noticed, meaning that millions may have to get sick before a change is investigated. Tracking the impact of GM foods is even more difficult in North America, where the foods are not labeled.
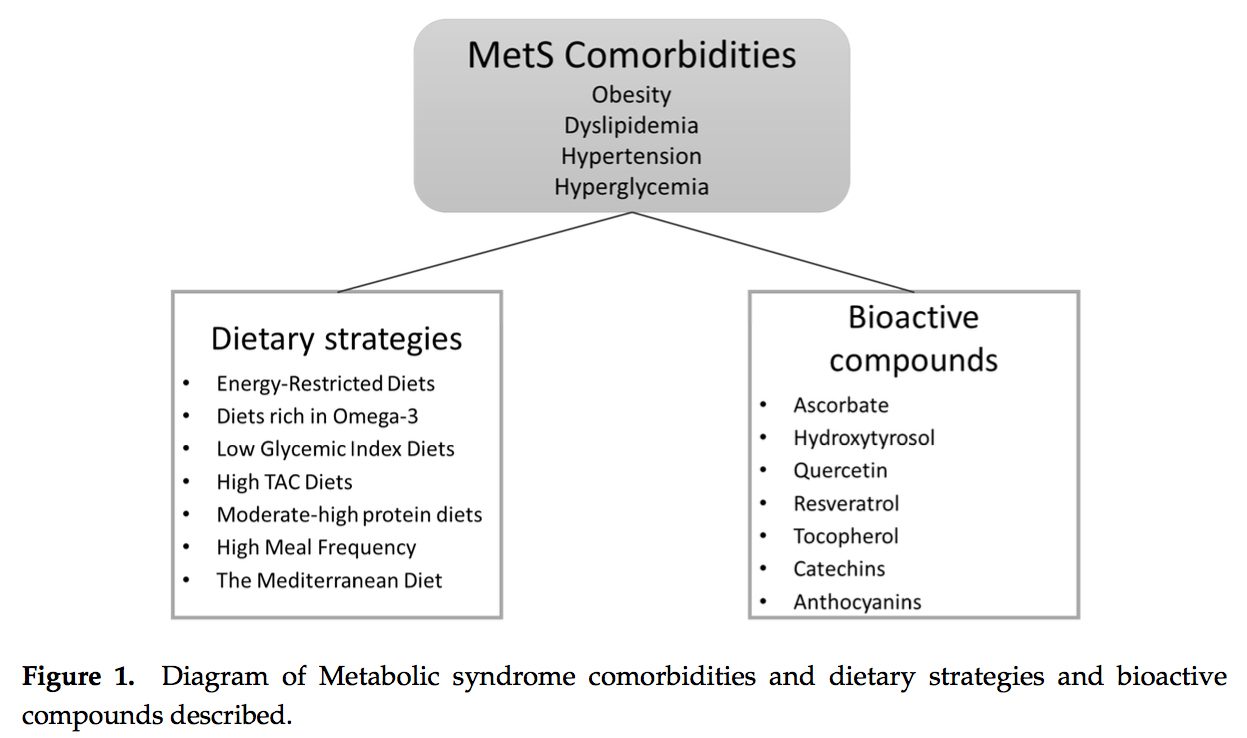
 It was during the period between 1910 and 1920 when it was suggested for the first time that a cluster of associated metabolic disturbances tended to coexist together [1]. Since then, different health organisms have suggested diverse definitions for metabolic syndrome (MetS) but there has not yet been a well-established consensus. The most common definitions are summarized in Table 1. What is clear for all of these is that the MetS is a clinical entity of substantial heterogeneity, commonly represented by the combination of obesity (especially abdominal obesity), hyperglycemia, dyslipidemia and/or hypertension [2�6].
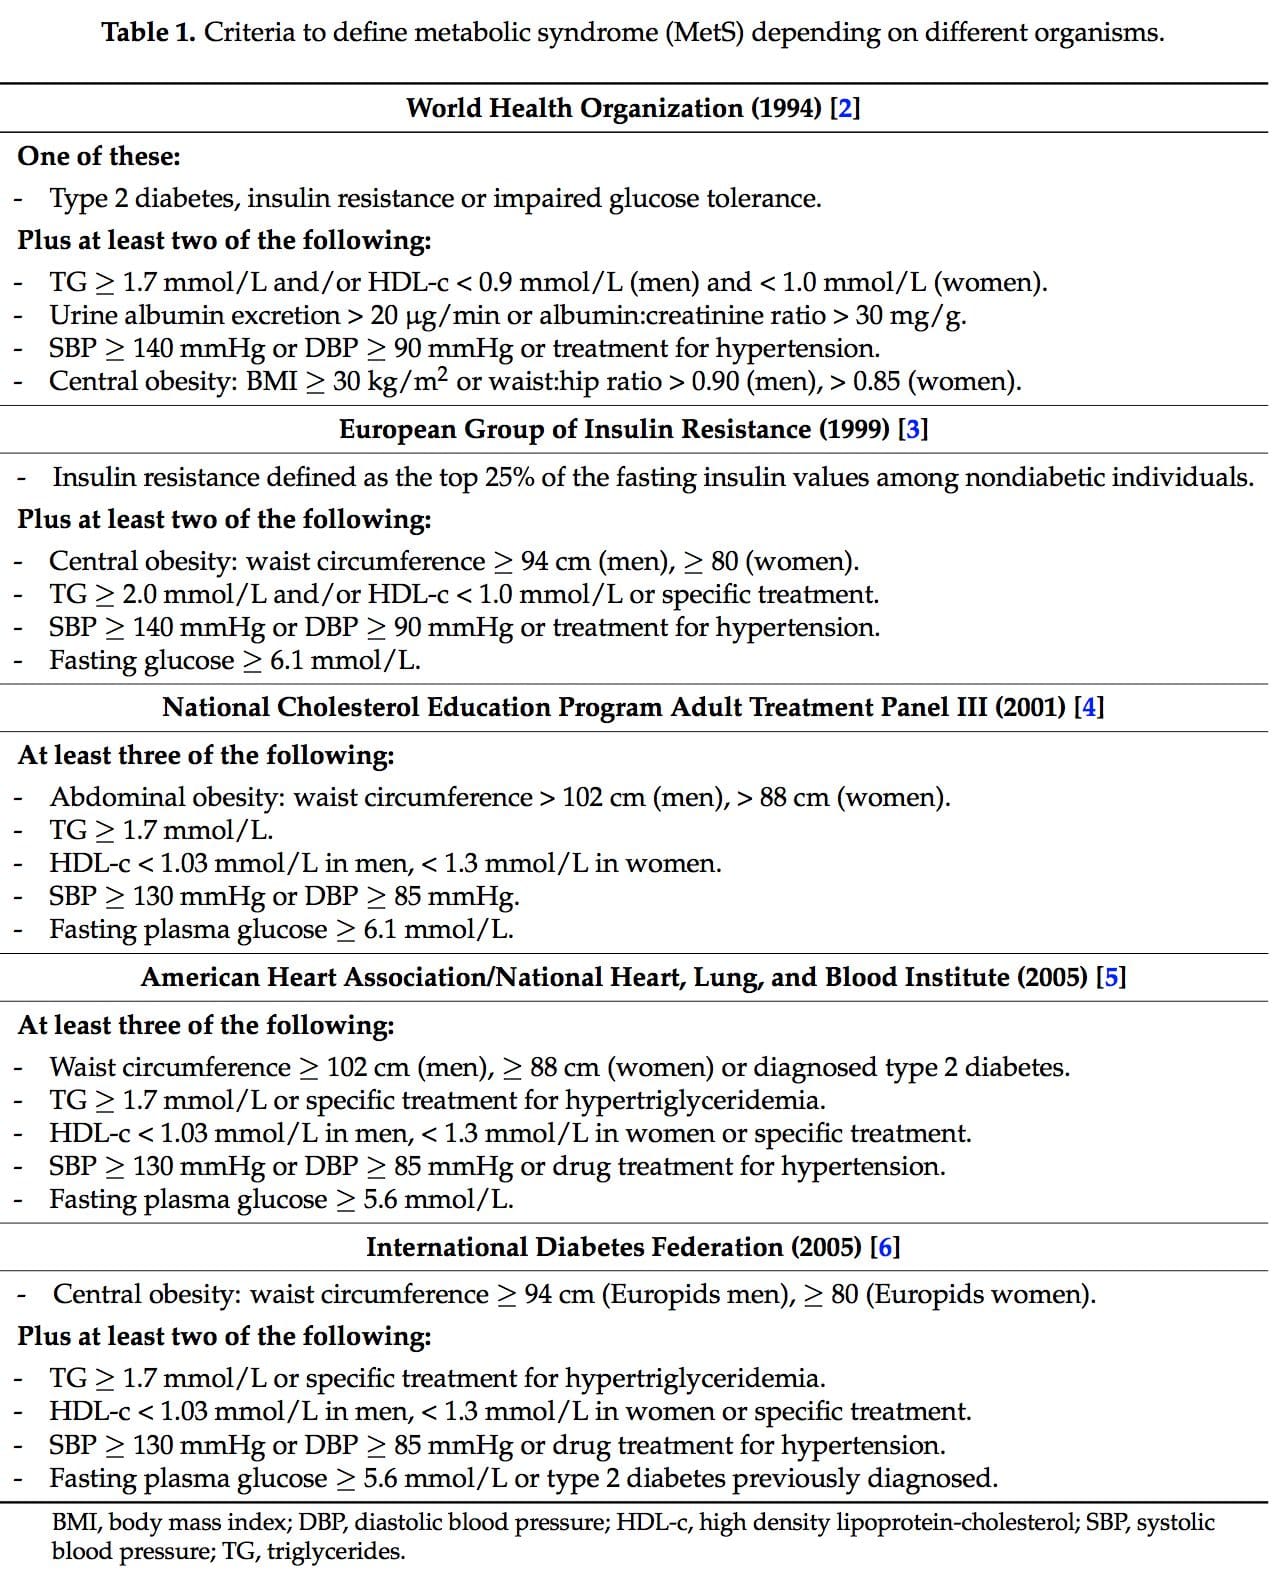
 Several dietary strategies and their potential positive effects on the prevention and treatment of the different metabolic complications associated to the MetS, are described below and summarized in Table 2.
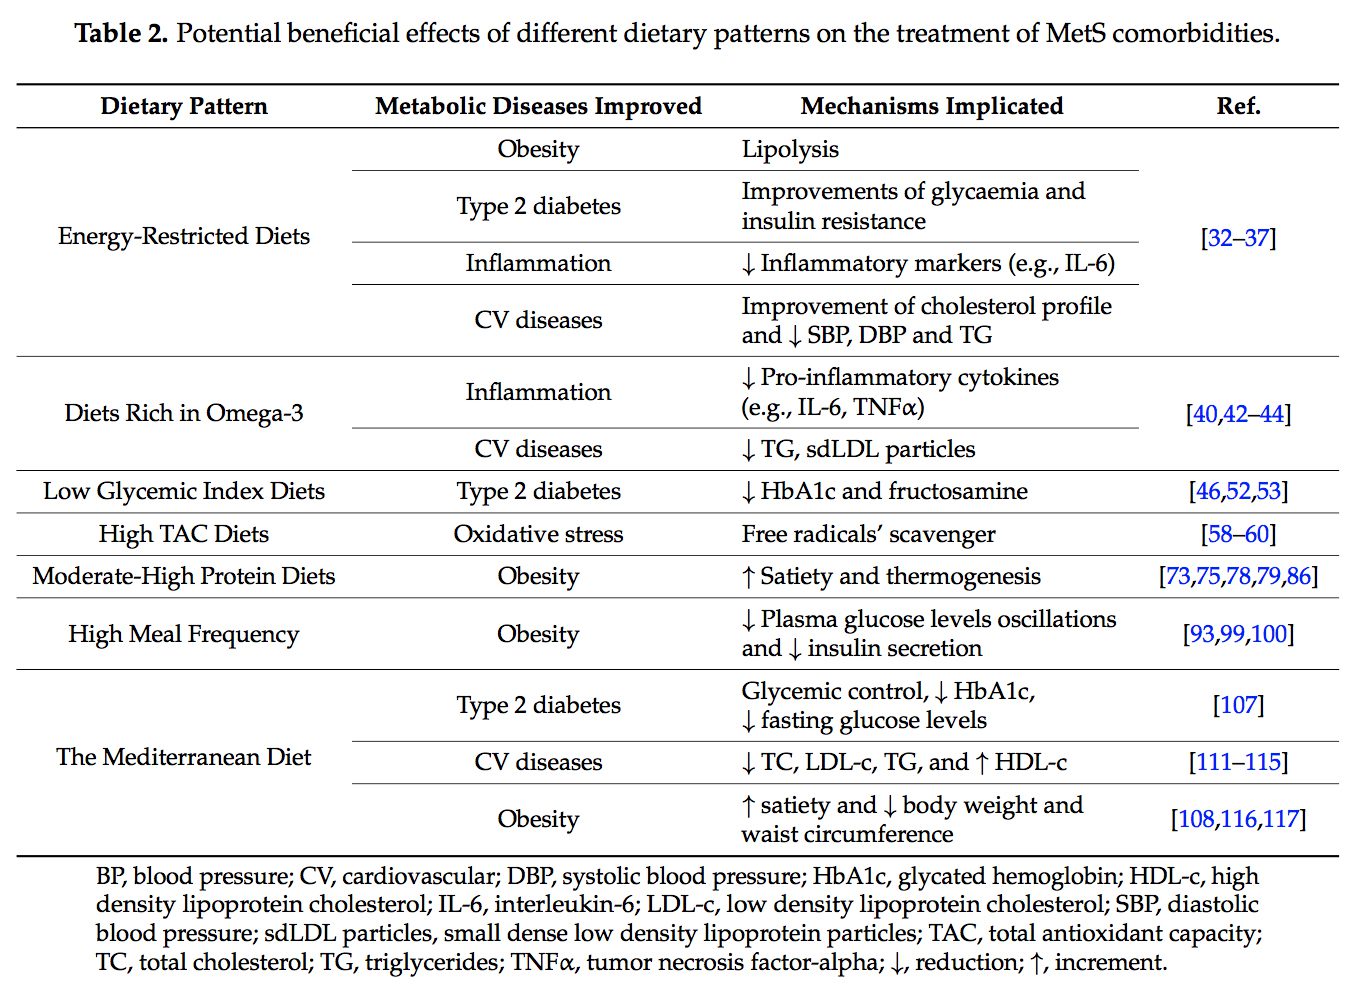 2.1. Energy-Restricted Diet Strategies
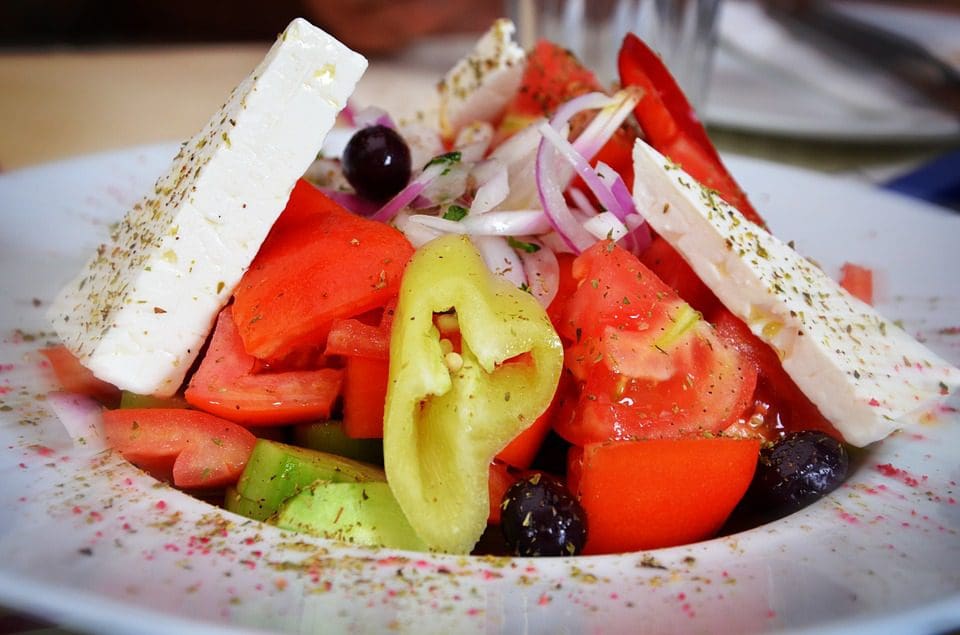
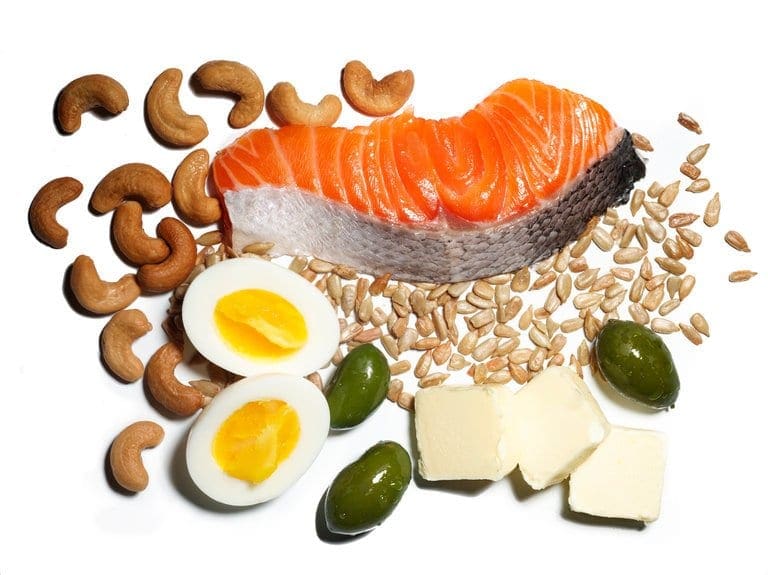
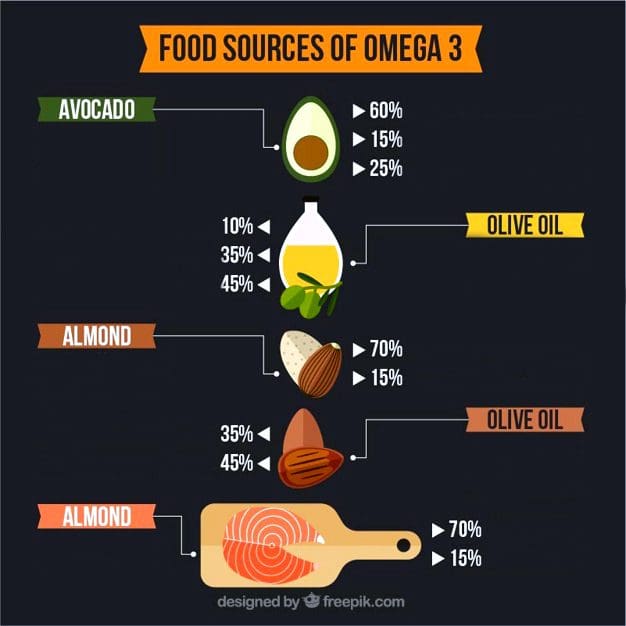 The very long-chain eicosapentaenoic acid (EPA) and docosahexaenoic acid (DHA) are essential omega-3 polyunsaturated fatty acids (n-3 PUFAs) for human physiology. Their main dietary sources are fish and algal oils and fatty fish, but they can also be synthesized by humans from ?-linolenic acid [40].
 Over the last ten years, the concern about the quality of the carbohydrates (CHO) consumed has risen [46]. In this context, the glycemic index (GI) is used as a CHO quality measure. It consists in a ranking on a scale from 0 to 100 that classifies carbohydrate-containing foods according to the postprandial glucose response [47]. The higher the index, the more promptly the postprandial serum glucose rises and the more rapid the insulin response. A quick insulin response leads to rapid hypoglycemia, which is suggested to be associated with an increment of the feeling of hunger and to a subsequent higher caloric intake [47]. The glycemic load (GL) is equal to the GI multiplied by the number of grams of CHO in a serving [48].
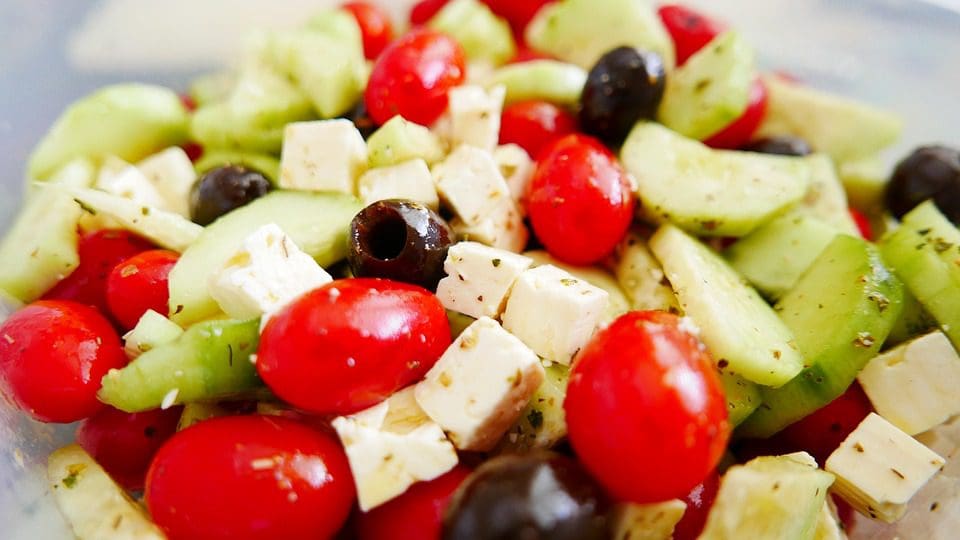
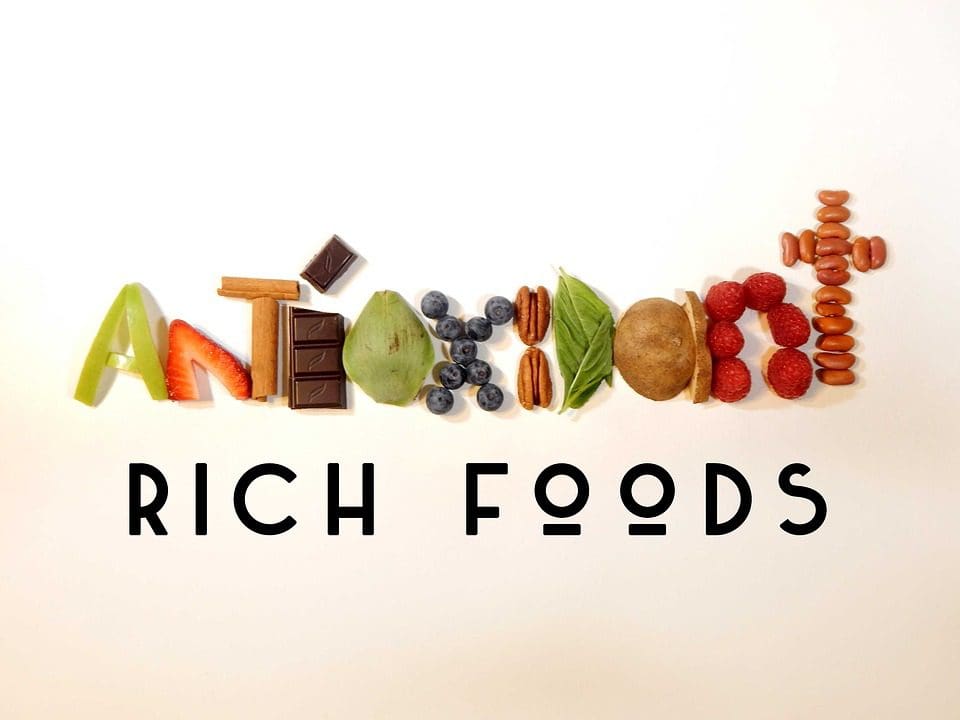 Dietary total antioxidant capacity (TAC) is an indicator of diet quality defined as the sum of antioxidant activities of the pool of antioxidants present in a food [55]. These antioxidants have the capacity to act as scavengers of free radicals and other reactive species produced in the organisms [56]. Taking into account that oxidative stress is one of the remarkable unfortunate physiological states of MetS, dietary antioxidants are of main interest in the prevention and treatment of this multifactorial disorder [57]. Accordingly, it is well-accepted that diets with a high content of spices, herbs, fruits, vegetables, nuts and chocolate, are associated with a decreased risk of oxidative stress-related diseases development [58�60]. Moreover, several studies have analyzed the effects of dietary TAC in individuals suffering from MetS or related diseases [61,62]. In the Tehran Lipid and Glucose Study it was demonstrated that a high TAC has beneficial effects on metabolic disorders and especially prevents weight and abdominal fat gain [61]. In the same line, research conducted in our institutions also evidenced that beneficial effects on body weight, oxidative stress biomarkers and other MetS features were positively related with higher TAC consumption in patients suffering from MetS [63�65].
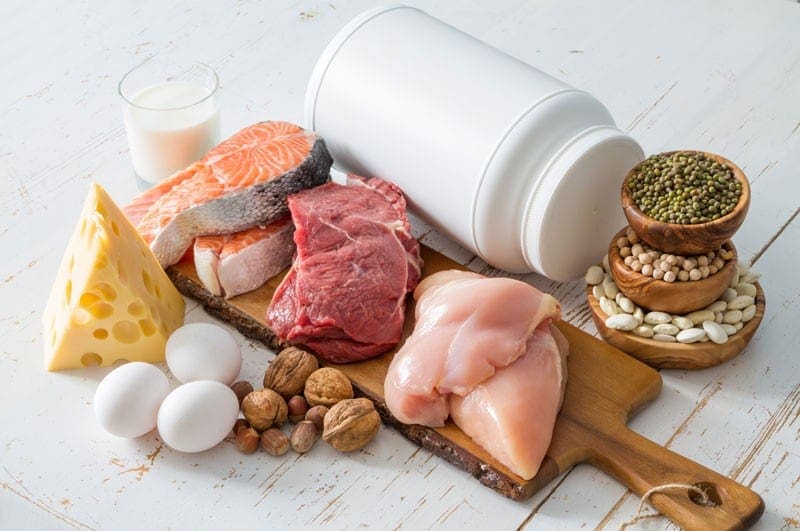
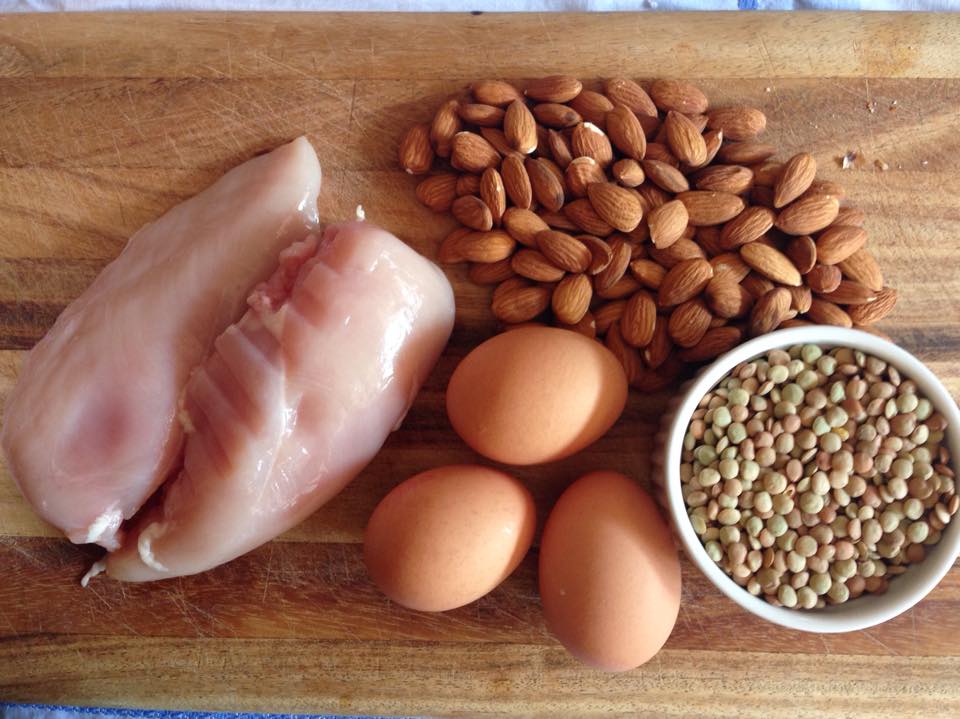 The macronutrient distribution set in a weight loss dietary plan has commonly been 50%�55% total caloric value from CHO, 15% from proteins and 30% from lipids [57,68]. However, as most people have difficulty in maintaining weight loss achievements over time [69,70], research on increment of protein intake (>20%) at the expense of CHO was carried out [71�77].
 The concept of the
 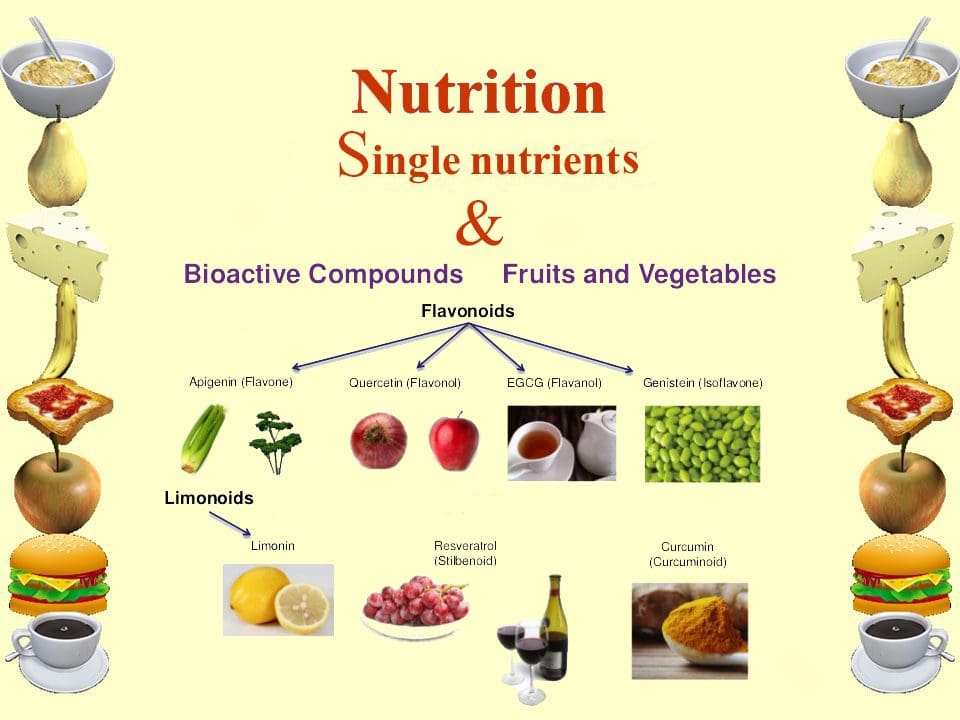 New studies focused on the molecular action of nutritional bioactive compounds with positive effects on MetS are currently an objective of scientific research worldwide with the aim of designing more personalized strategies in the framework of molecular nutrition. Among them, flavonoids and antioxidant vitamins are some of the most studied compounds with different potential benefits such as antioxidant, vasodilatory, anti-atherogenic, antithrombotic, and anti-inflammatory effects [119]. Table 3 summarizes different nutritional bioactive compounds with potential positive effects on MetS, including the possible molecular mechanism of action involved.
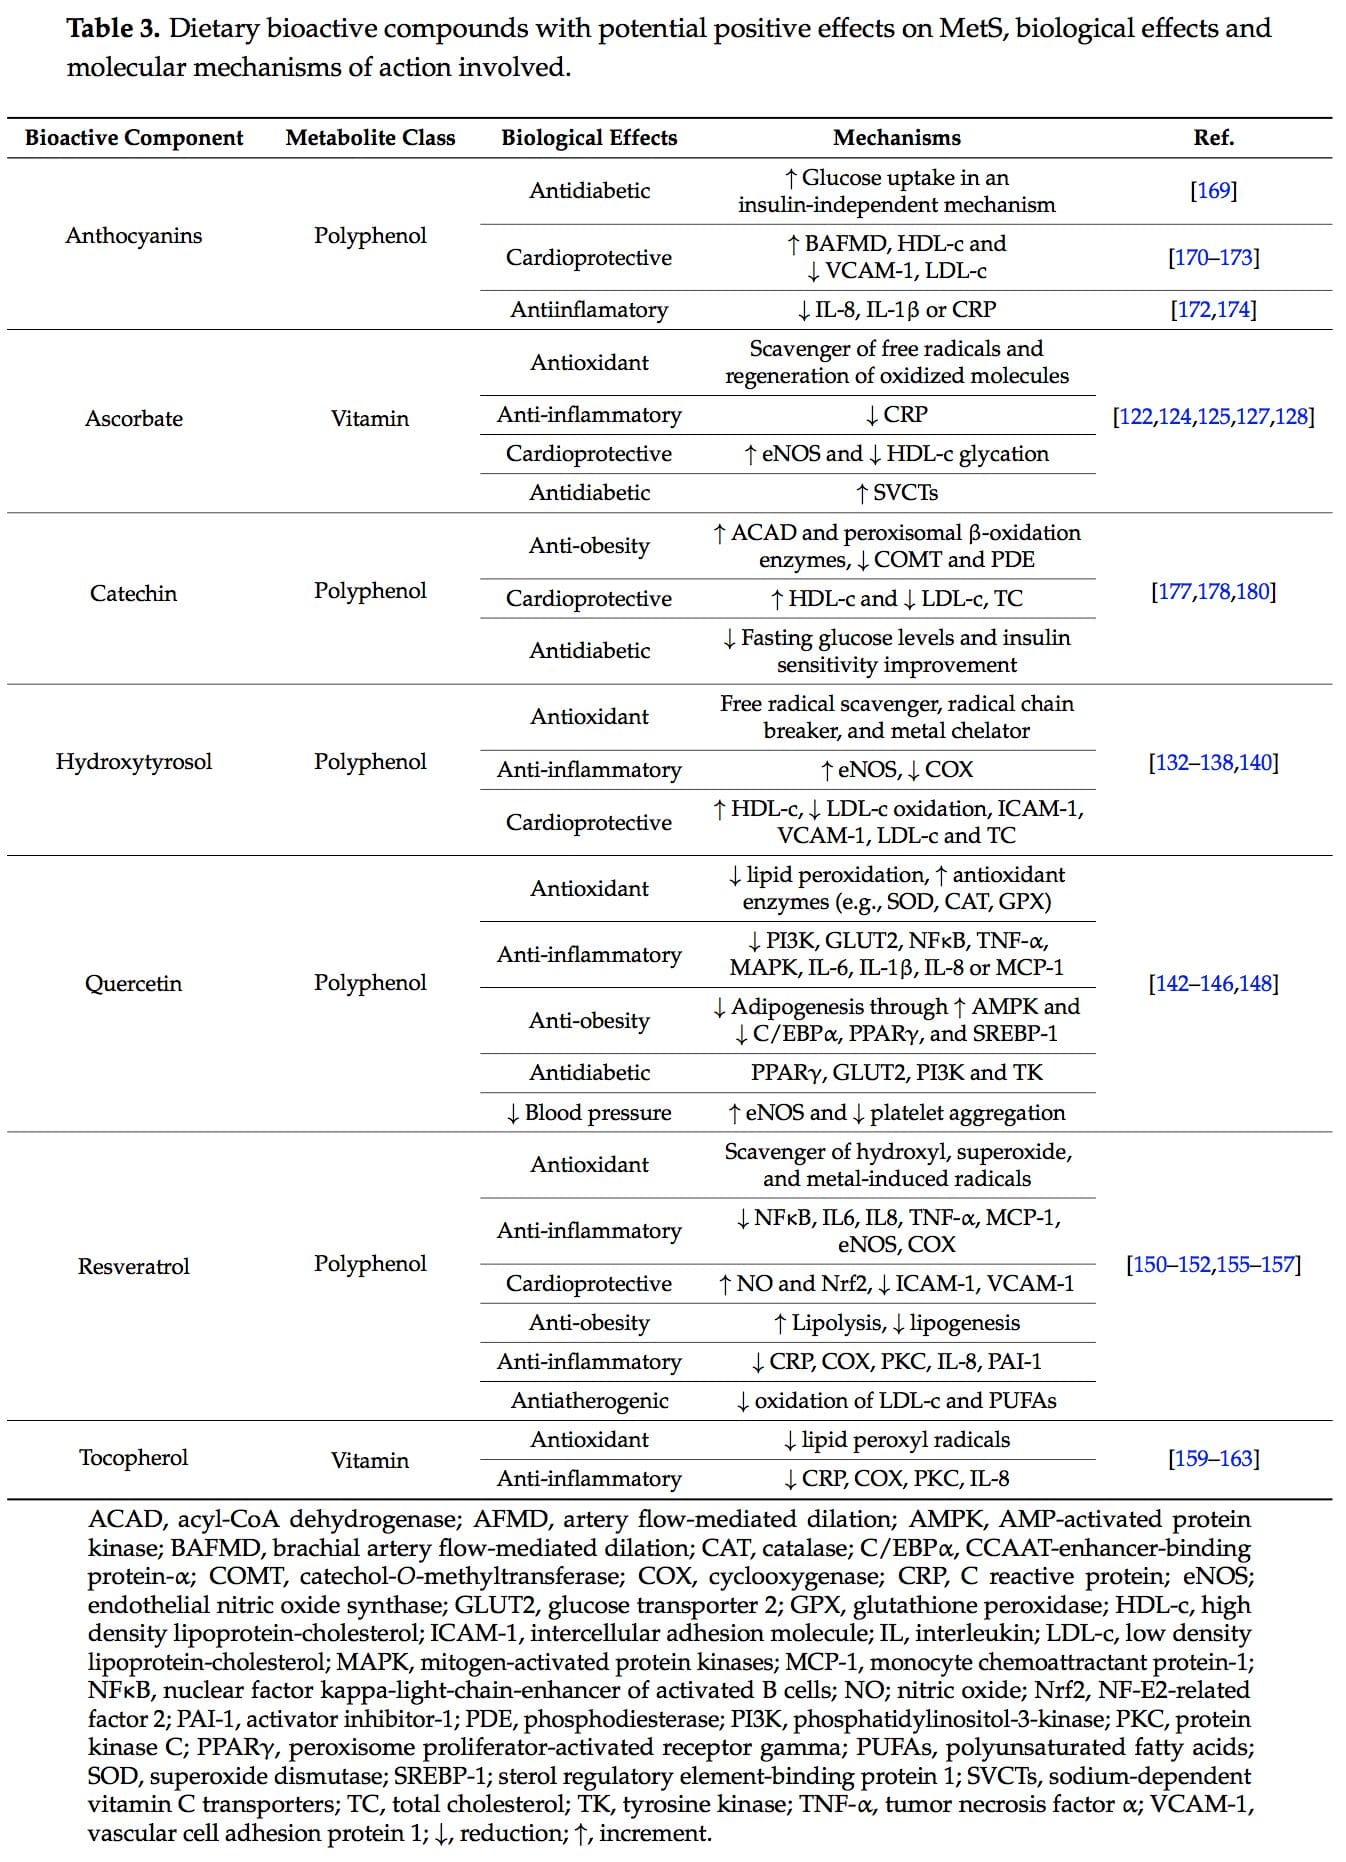
 Vitamin C, ascorbic acid or ascorbate is an essential nutrient as human beings cannot synthesize it. It is a water-soluble antioxidant mainly found in fruits, especially citrus (lemon, orange), and vegetables (pepper, kale) [120]. Several beneficial effects have been associated to this vitamin such as antioxidant and anti-inflammatory properties and prevention or treatment of CVD and type 2 diabetes [121�123].
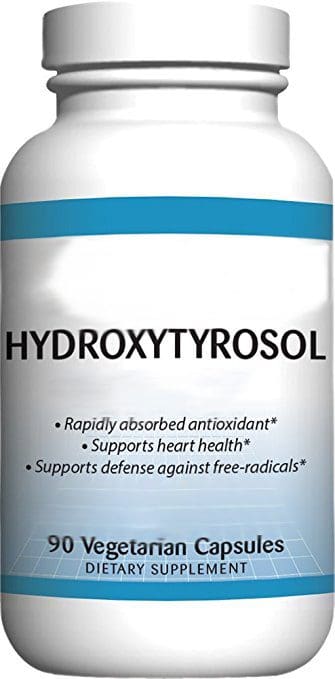 Hydroxytyrosol (3,4-dihydroxyphenylethanol) is a phenolic compound mainly found in olives [132].
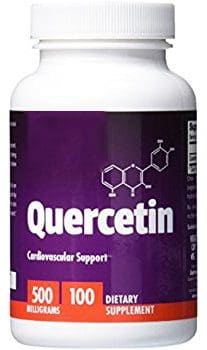 Quercetin is a predominant flavanol naturally present in vegetables, fruits, green tea or red wine. It is commonly found as glycoside forms, where rutin is the most common and important structure found in nature [141].
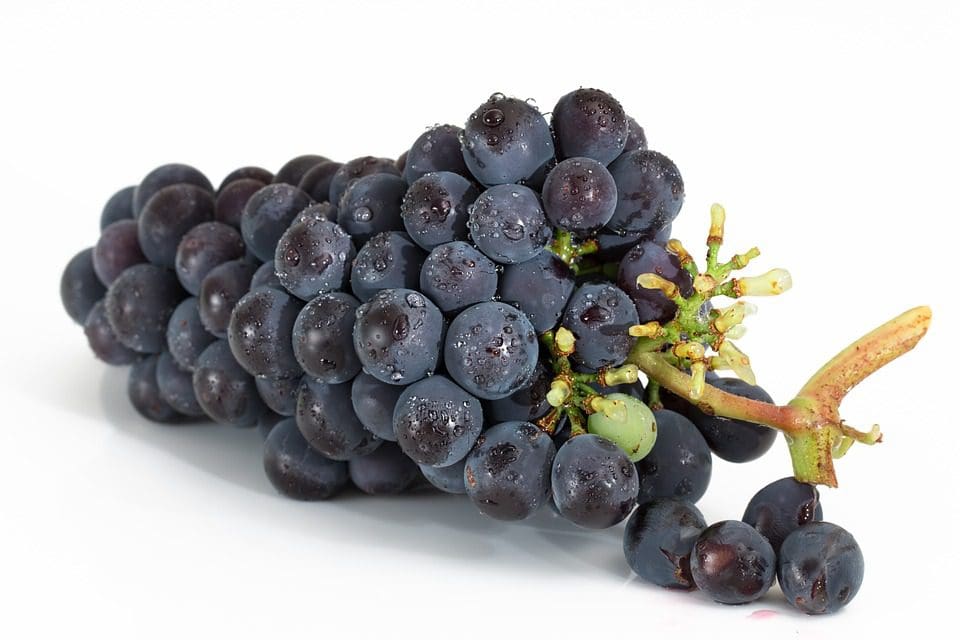
 Tocopherols, also known as vitamin E, are a family of eight fat-soluble phenolic compounds whose main dietary sources are vegetable oils, nuts and seeds [130,158].
 Catechins are polyphenols that can be found in a variety of foods including fruits, vegetables, chocolate, wine, and tea [175]. The epigallocatechin 3-gallate present in tea leaves is the catechin class most studied [176].